

Question: Complete these exercises after reading the experiment but before coming to the laboratory to do it . The data graphed in Figure 4 . 1
Complete these exercises after reading the experiment but before coming to the laboratory to do it
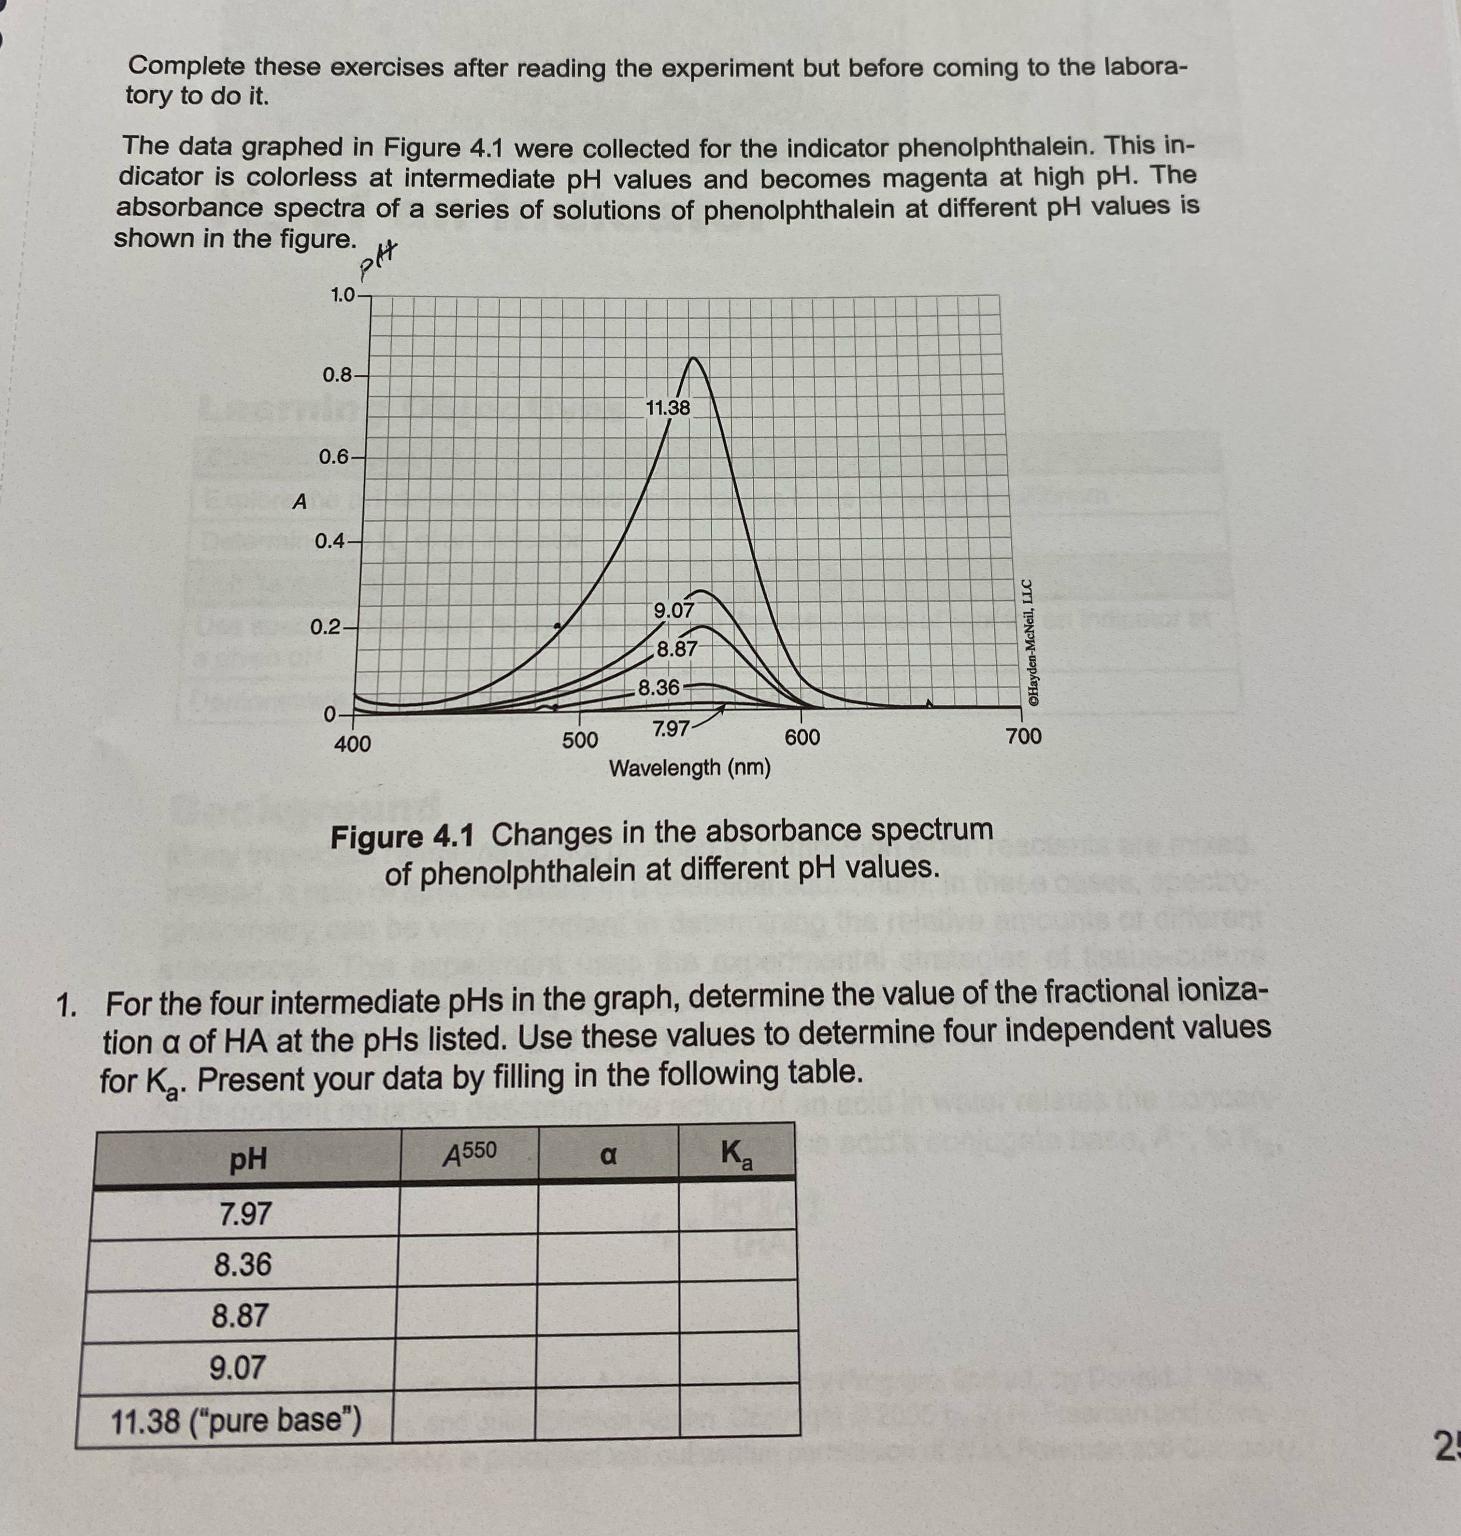
The data graphed in Figure were collected for the indicator phenolphthalein. This indicator is colorless at intermediate values and becomes magenta at high The absorbance spectra of a series of solutions of phenolphthalein at different values is shown in the figure.
Figure Changes in the absorbance spectrum of phenolphthalein at different values.
For the four intermediate in the graph, determine the value of the fractional ionization of HA at the pHs listed. Use these values to determine four independent values for Present your data by filling in the following table.
table
Step by Step Solution
There are 3 Steps involved in it
1 Expert Approved Answer
Step: 1 Unlock

Question Has Been Solved by an Expert!
Get step-by-step solutions from verified subject matter experts
Step: 2 Unlock
Step: 3 Unlock