

Question: Complete this assignment a fter understanding our lecture notes and PowerPoint slides on univariate descriptive analysis . 1. Get into Microsoft Excel and load the
Complete this assignment after understanding our lecture notes and PowerPoint slides on univariate descriptive analysis.
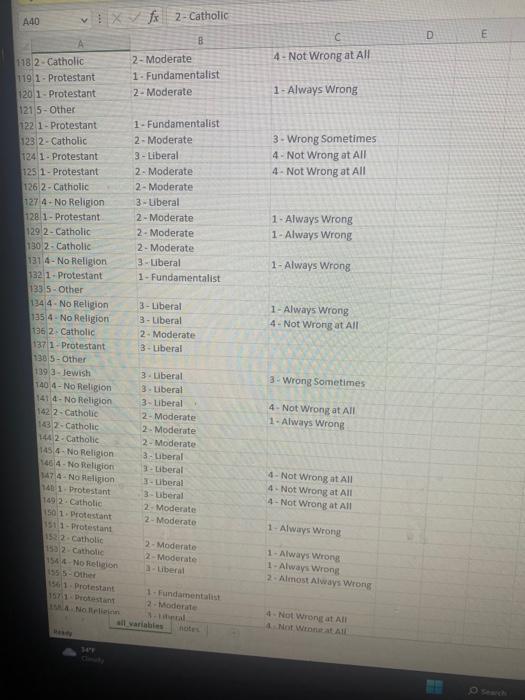
1. Get into Microsoft Excel and load the hw1_data.xlsx from D2L. This dataset is taken from the General Social Survey.
Have Excel produce a frequency distribution and bar chart for the variable relig. (Lecture 1 PPT slides provide the steps in creating frequency tables in Excel.) You must have pivot tables for absolute frequency counts, relative frequency (percent), and valid relative frequency (valid percent). Answer the following questions:
a. How many people in this sample are Protestants? Catholics? Jews? (5 points)
b. What percentage of all respondents have no religion? What percentage of valid respondents have no religion? How are these two numbers calculated? (5 points)
c. What advantage(s) and disadvantages do you see presenting a bar chart in place of a frequency table? (5 points)


3. 4 - Dont kingw/No Answer A42 vxfx5-other A42 v4fx s-Other D 1) PROTECIED ViEW Be careful-files from the internet can contain viruses, Unless you need to edit it's safer
Step by Step Solution
There are 3 Steps involved in it
1 Expert Approved Answer
Step: 1 Unlock

Question Has Been Solved by an Expert!
Get step-by-step solutions from verified subject matter experts
Step: 2 Unlock
Step: 3 Unlock