

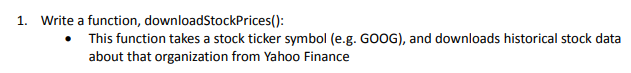
Question: Complete this in JavaFX. Download stock data from: https://www.alphavantage.co/support/#api-key 1. Write a function, downloadStockPrices): about that organization from Yahoo Finance 2. Write a function, drawLinePlot():
Complete this in JavaFX.
Download stock data from: https://www.alphavantage.co/support/#api-key
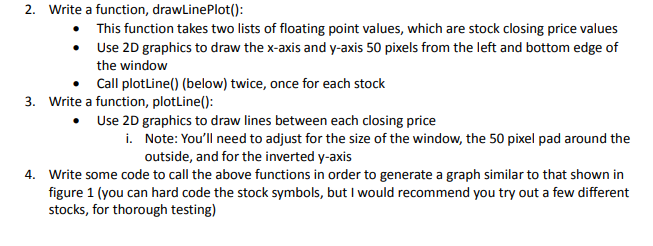
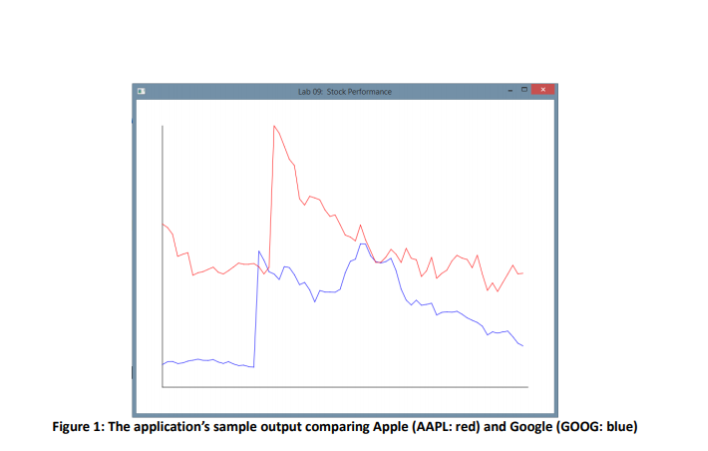
1. Write a function, downloadStockPrices): about that organization from Yahoo Finance 2. Write a function, drawLinePlot(): This function takes two lists of floating point values, which are stock closing price values Use 2D graphics to draw the x-axis and y-axis 50 pixels from the left and bottom edge of the window Call plotLine() (below) twice, once for each stock 3. Write a function, plotLine(): Use 2D graphics to draw lines between each closing price . Note: You'll need to adjust for the size of the window, the 50 pixel pad around the outside, and for the inverted y-axis i. Write some code to call the above functions in order to generate a graph similar to that shown in figure 1 (you can hard code the stock symbols, but I would recommend you try out a few different stocks, for thorough testing) 4. Figure 1: The application's sample output comparing Apple (AAPL: red) and Google (GOOG: blue) 1. Write a function, downloadStockPrices): about that organization from Yahoo Finance 2. Write a function, drawLinePlot(): This function takes two lists of floating point values, which are stock closing price values Use 2D graphics to draw the x-axis and y-axis 50 pixels from the left and bottom edge of the window Call plotLine() (below) twice, once for each stock 3. Write a function, plotLine(): Use 2D graphics to draw lines between each closing price . Note: You'll need to adjust for the size of the window, the 50 pixel pad around the outside, and for the inverted y-axis i. Write some code to call the above functions in order to generate a graph similar to that shown in figure 1 (you can hard code the stock symbols, but I would recommend you try out a few different stocks, for thorough testing) 4. Figure 1: The application's sample output comparing Apple (AAPL: red) and Google (GOOG: blue)
Step by Step Solution
There are 3 Steps involved in it

Get step-by-step solutions from verified subject matter experts