

Question: Complete this using Tableau, please do not use coding software like python, and do not try to the compute the key tasks using just math,
Complete this using Tableau, please do not use coding software like python, and do not try to the compute the key tasks using just math, since the task is to actually make visualizations in Tableau that can answer the key task requirements.
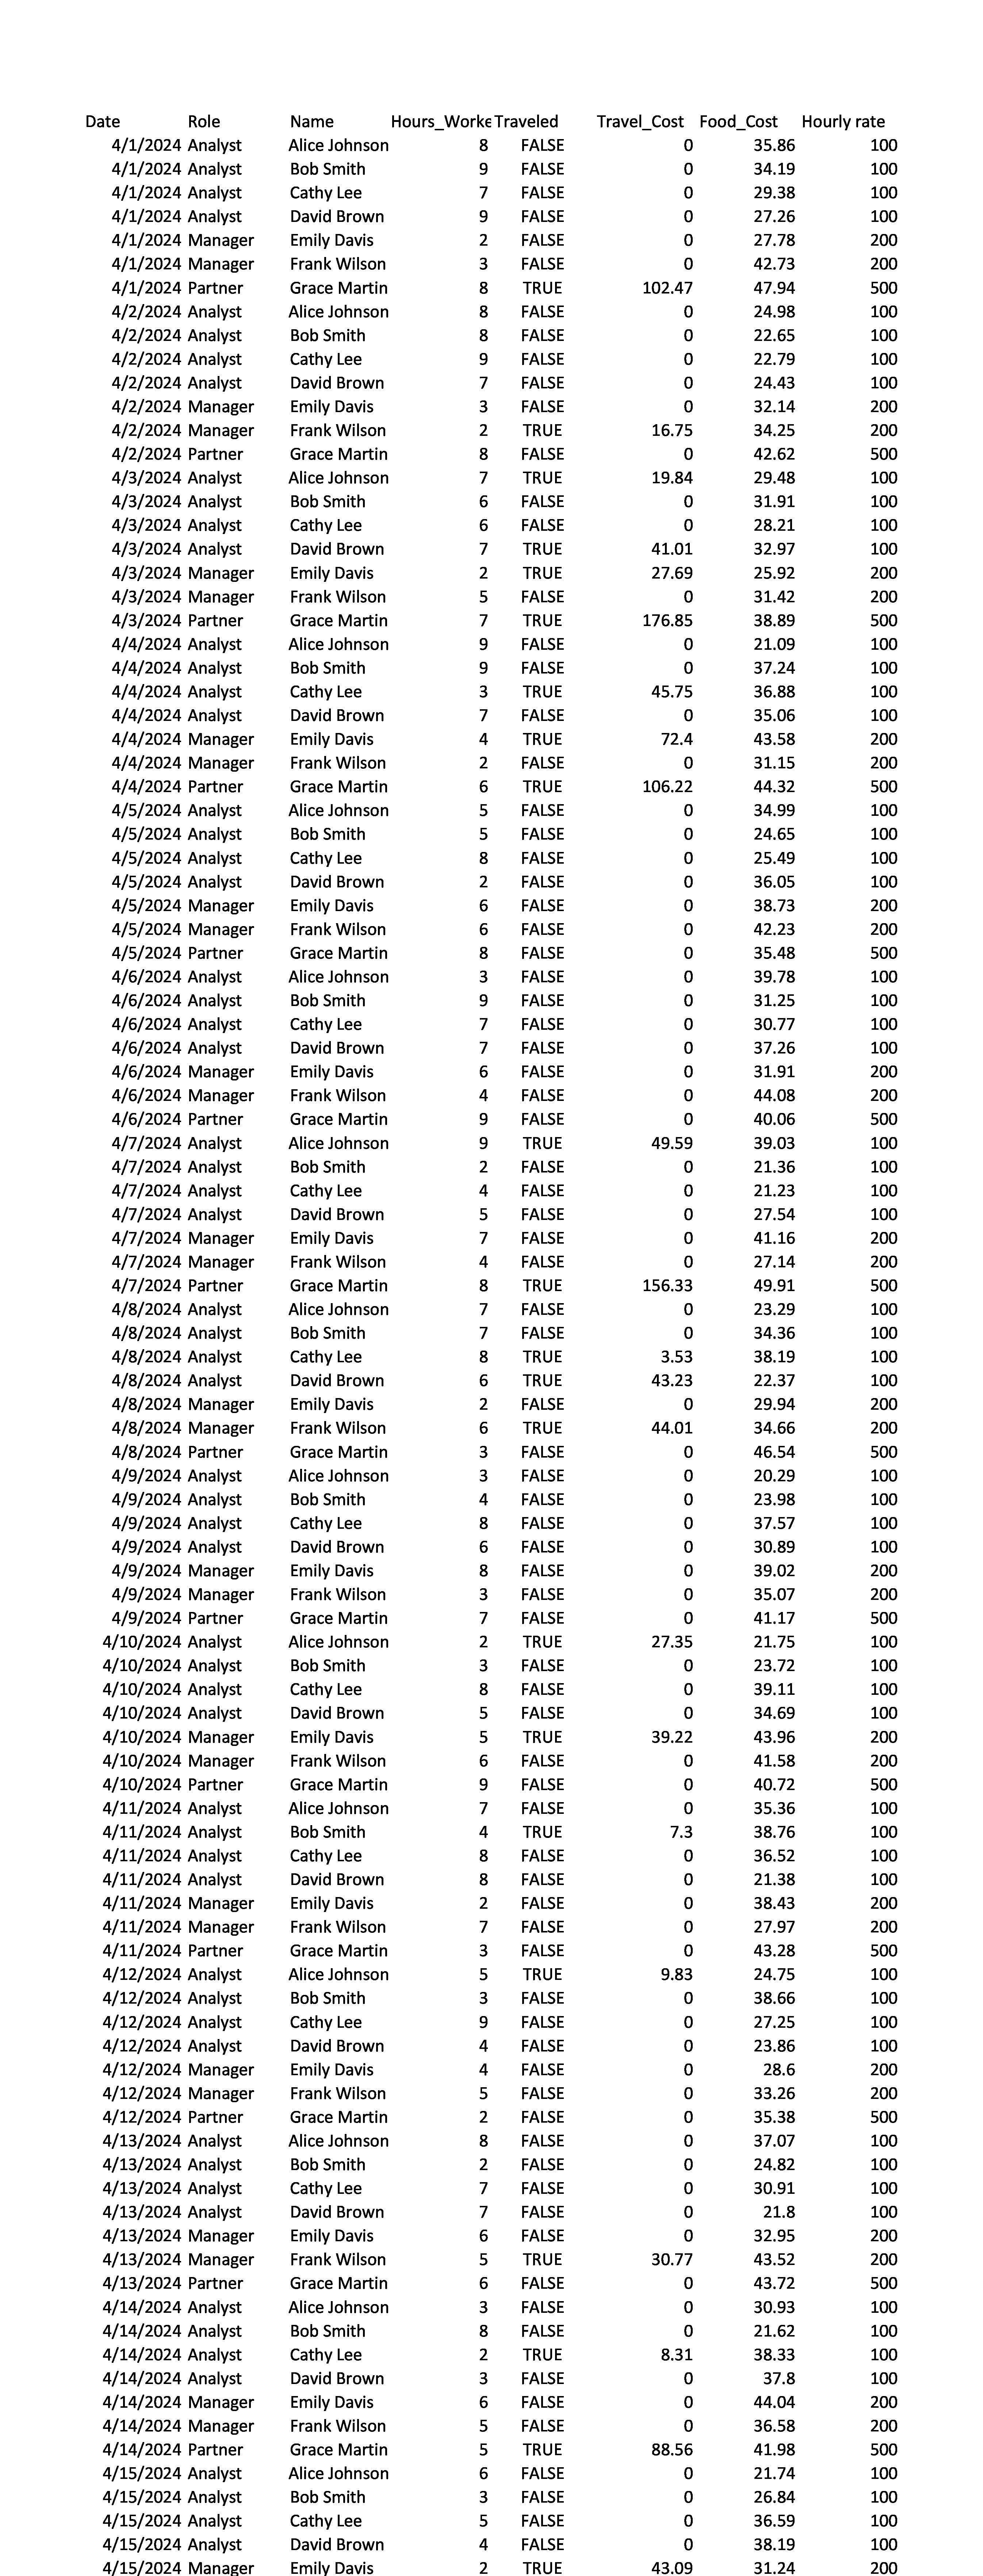
The images uploaded is the data for the Budget vs Actuals excel, please extract and convert to an excel file in order to use in Tableau.
Overview
Imagine you work for a firm that is leading a project for a major client. The projects budget and actual expenditures need to be reviewed to ensure that the project is on track and to identify any variances that may require attention.
In this project, there are many different employees in different roles, all with different hourly rates and amounts of time they can bill to a project. The data includes time billed to a project by each person, that persons role, and their hourly bill rate. You are assigned to prepare visualizations comparing the projects budget to actual status.
Assume we have completed of the overall amount of work done meaning we are behind schedule, we should have completed about if we started April st and end September stAlso assume that our budget for the project was one million dollars. We had allotted $of the budget to the partner's hours, $to the manager's hours, $to the analyst's hours, $for travel for everyoneand $for food for everyone
Assume the project is due on
Key Tasks
Upload the Budget vs Actuals.xlsx data set in Tableau
Specifically, we want you to visualize whether these things are on track:
Overall budget for the project relative to the amount of work doneAmount of work done relative to where we should be at this point in the project based on the timelineThe amount of budget allocated to analysts, associates, managers, senior managers, and partners, compared to the actual amount spent thus farTravel costs compared to the amount budgeted
Prepare at least three visualizations
Execute on all prior knowledge of data visualization best practices up to this point
Step by Step Solution
There are 3 Steps involved in it
1 Expert Approved Answer
Step: 1 Unlock

Question Has Been Solved by an Expert!
Get step-by-step solutions from verified subject matter experts
Step: 2 Unlock
Step: 3 Unlock