

Question: Complete Two Linear Regressions Open a new sheet for each regression. For our regressions, we are interested only in meteorites that weigh between 50,000 and
Complete Two Linear Regressions
Open a new sheet for each regression. For our regressions, we are interested only in meteorites that weigh between 50,000 and 250,000 grams (you will need to use a filter here). For your first regression, use Longitude as the independent (X) variable and Mass as the dependent (Y) variable. You will notice that when you drag these two variables to their appropriate Shelf, you will only see one dot on your canvas. Use the Analysis menu to unselect Aggregate measures. Once you do so you should see a scatter plot.
For some reason, my table is not looking like it should, this is what I have so far.
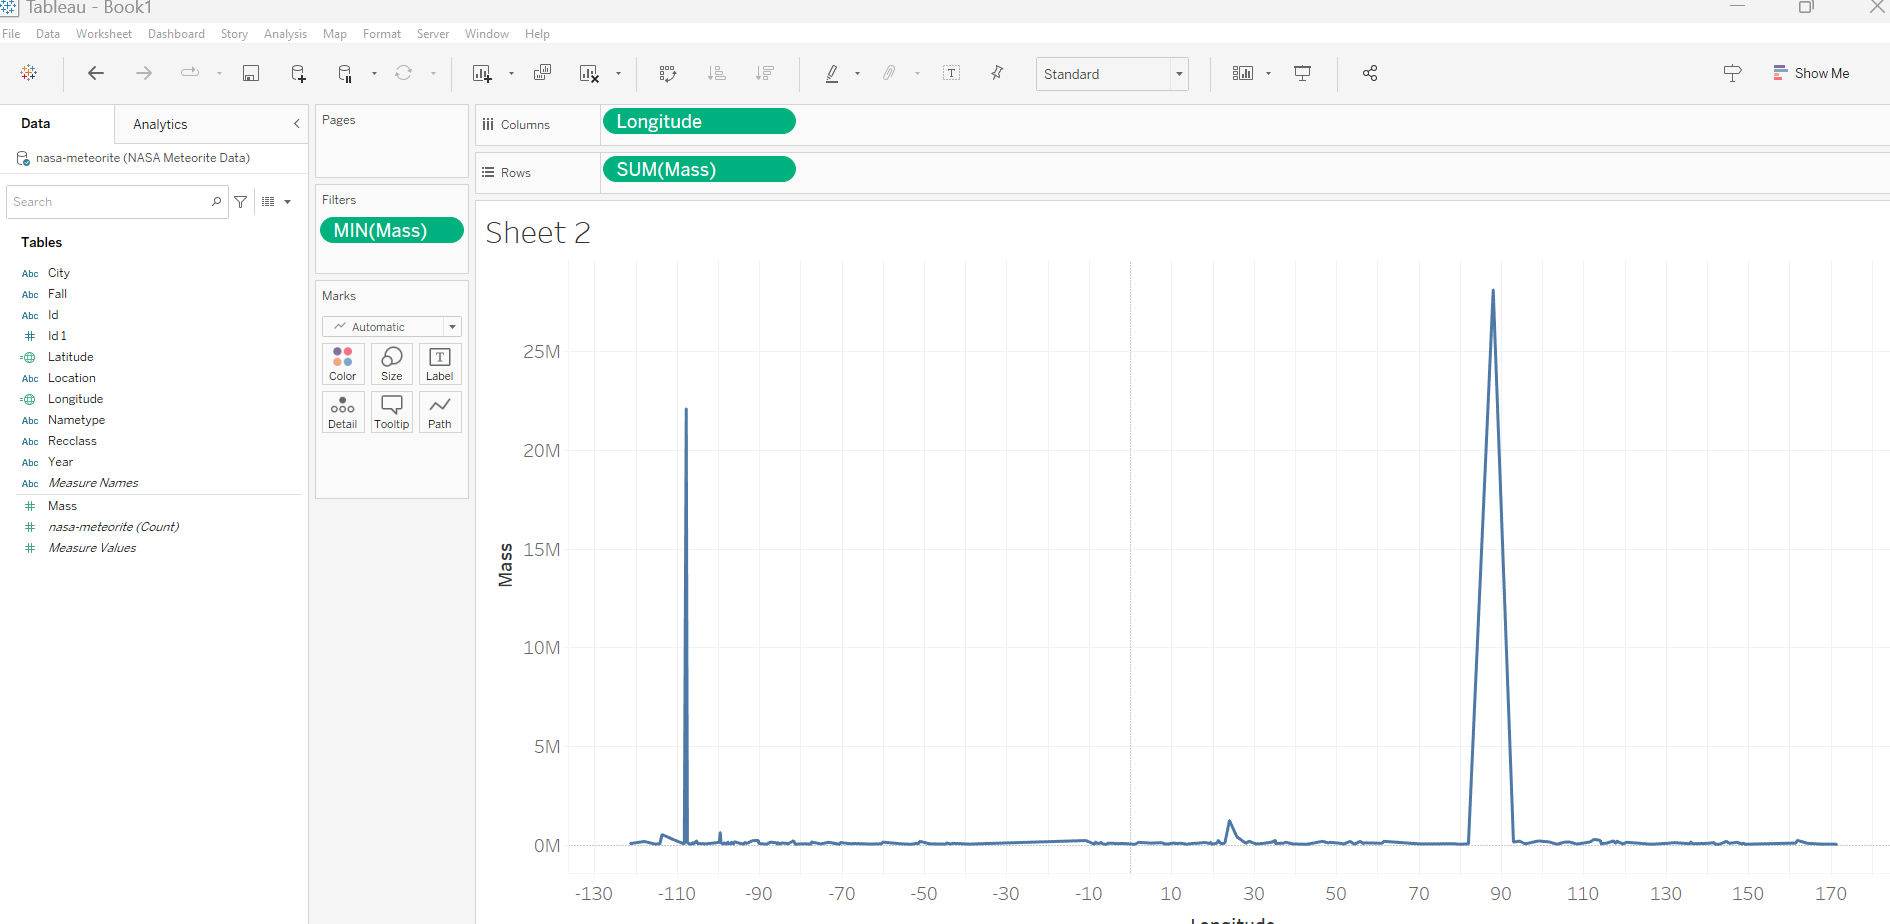
Tableau - Book' File Data Worksheet Dashboard Story Analysis Map Format Server Window Help Data Oonasa-meteorite (NASA Meteorite Data) Search Tables Abc City Abc Fall Abc Id \# Id 1 = Latitude Abc Location = Longitude Abc Nametype Abc Recclass Abc Year Abc Measure Names \# Mass \# nasa-meteorite (Count) \# Measure Va/ues \begin{tabular}{|c|c|c|} \hline \multicolumn{3}{|l|}{ Pages } \\ \hline \multicolumn{3}{|l|}{ Filters } \\ \hline \multicolumn{3}{|c|}{ MIN(Mass) } \\ \hline \multicolumn{3}{|l|}{ Marks } \\ \hline \multicolumn{3}{|c|}{ Automatic } \\ \hline8 & 0 & T \\ \hline Color & Size & Label \\ \hline \begin{tabular}{c} \\ Detail \end{tabular} & Tooltip & PathN \\ \hline \end{tabular} Sheet 2 Tableau - Book' File Data Worksheet Dashboard Story Analysis Map Format Server Window Help Data Oonasa-meteorite (NASA Meteorite Data) Search Tables Abc City Abc Fall Abc Id \# Id 1 = Latitude Abc Location = Longitude Abc Nametype Abc Recclass Abc Year Abc Measure Names \# Mass \# nasa-meteorite (Count) \# Measure Va/ues \begin{tabular}{|c|c|c|} \hline \multicolumn{3}{|l|}{ Pages } \\ \hline \multicolumn{3}{|l|}{ Filters } \\ \hline \multicolumn{3}{|c|}{ MIN(Mass) } \\ \hline \multicolumn{3}{|l|}{ Marks } \\ \hline \multicolumn{3}{|c|}{ Automatic } \\ \hline8 & 0 & T \\ \hline Color & Size & Label \\ \hline \begin{tabular}{c} \\ Detail \end{tabular} & Tooltip & PathN \\ \hline \end{tabular} Sheet 2
Step by Step Solution
There are 3 Steps involved in it

Get step-by-step solutions from verified subject matter experts