

Question: Completely the table by filing in the average fixed cost, average variable cost, and average total cost. a. Complete the table by filling in the
Completely the table by filing in the average fixed cost, average variable cost, and average total cost.
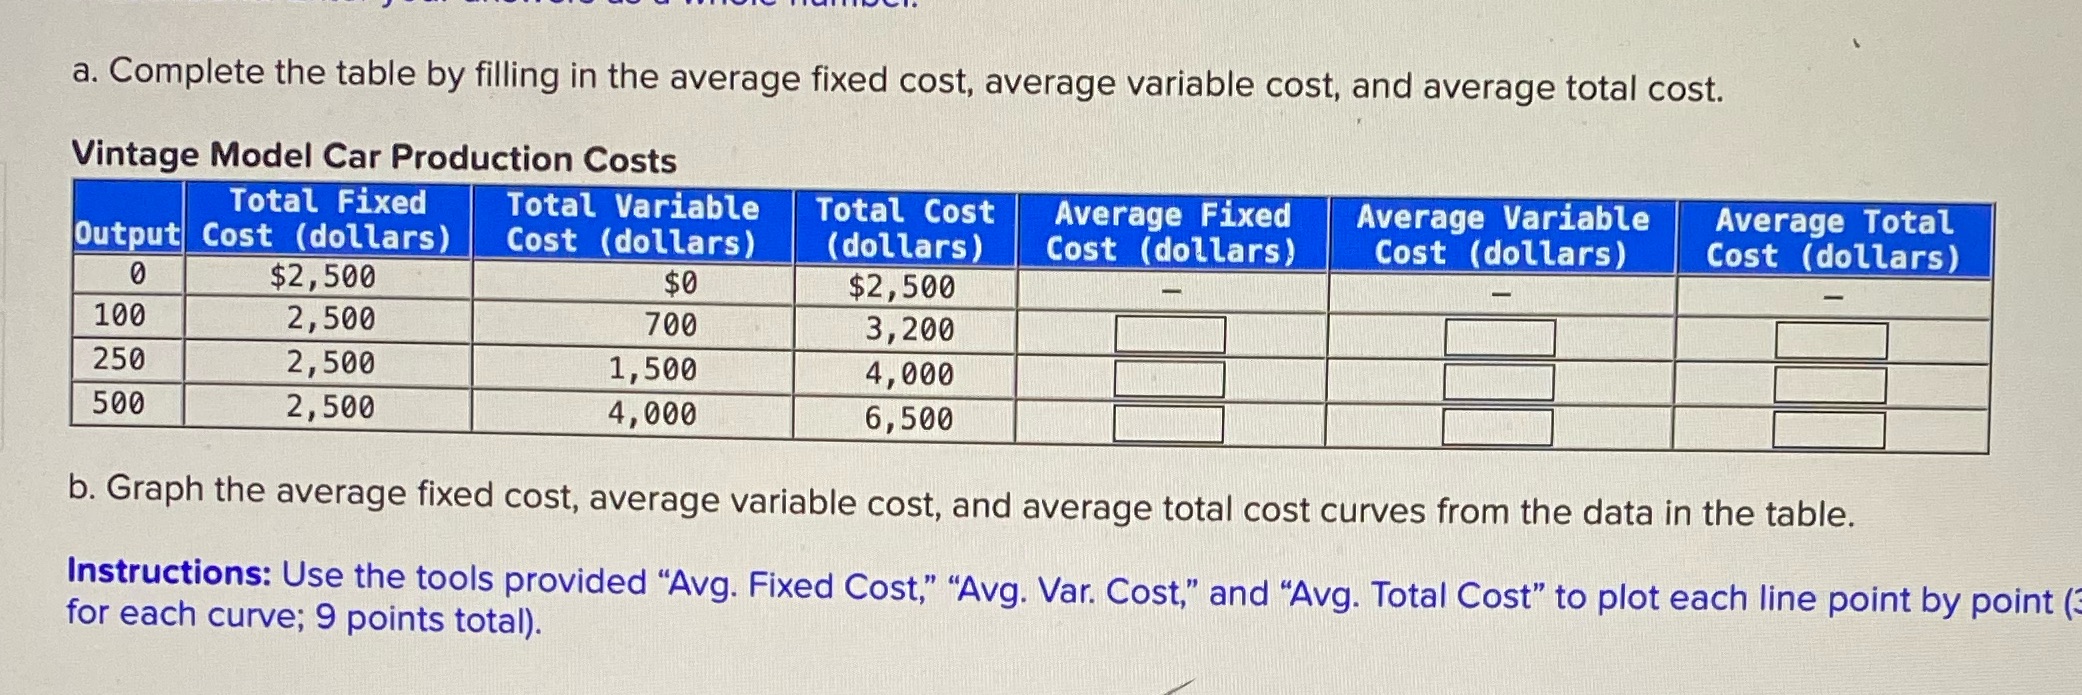
a. Complete the table by filling in the average fixed cost, average variable cost, and average total cost. Vintage Model Car Production Costs Total Fixed Total Variable Total Cost Average Fixed Average Variable Average Total Output Cost (dollars) Cost (dollars) (dollars) Cost (dollars) Cost (dollars) Cost (dollars) 0 $2, 500 $0 $2, 500 100 2, 500 700 3, 200 250 2, 500 1, 500 4,000 500 2 , 500 4, 000 6, 500 b. Graph the average fixed cost, average variable cost, and average total cost curves from the data in the table. Instructions: Use the tools provided "Avg. Fixed Cost," "Avg. Var. Cost," and "Avg. Total Cost" to plot each line point by point ( for each curve; 9 points total)
Step by Step Solution
There are 3 Steps involved in it

Get step-by-step solutions from verified subject matter experts