

Question: compose a beautiful essay for the following excerpt on chapter 5 of Rutger Bregman's Utopia for Realists, of about 150 words while directly quoting from
compose a beautiful essay for the following excerpt on chapter 5 of Rutger Bregman's Utopia for Realists, of about 150 words while directly quoting from the author's words (make direct in text citations, do not paraphrase), respond to by sharing your thoughts on Bregman's ideas about GDP.
Title Chapter 5: New Figures for a New Era
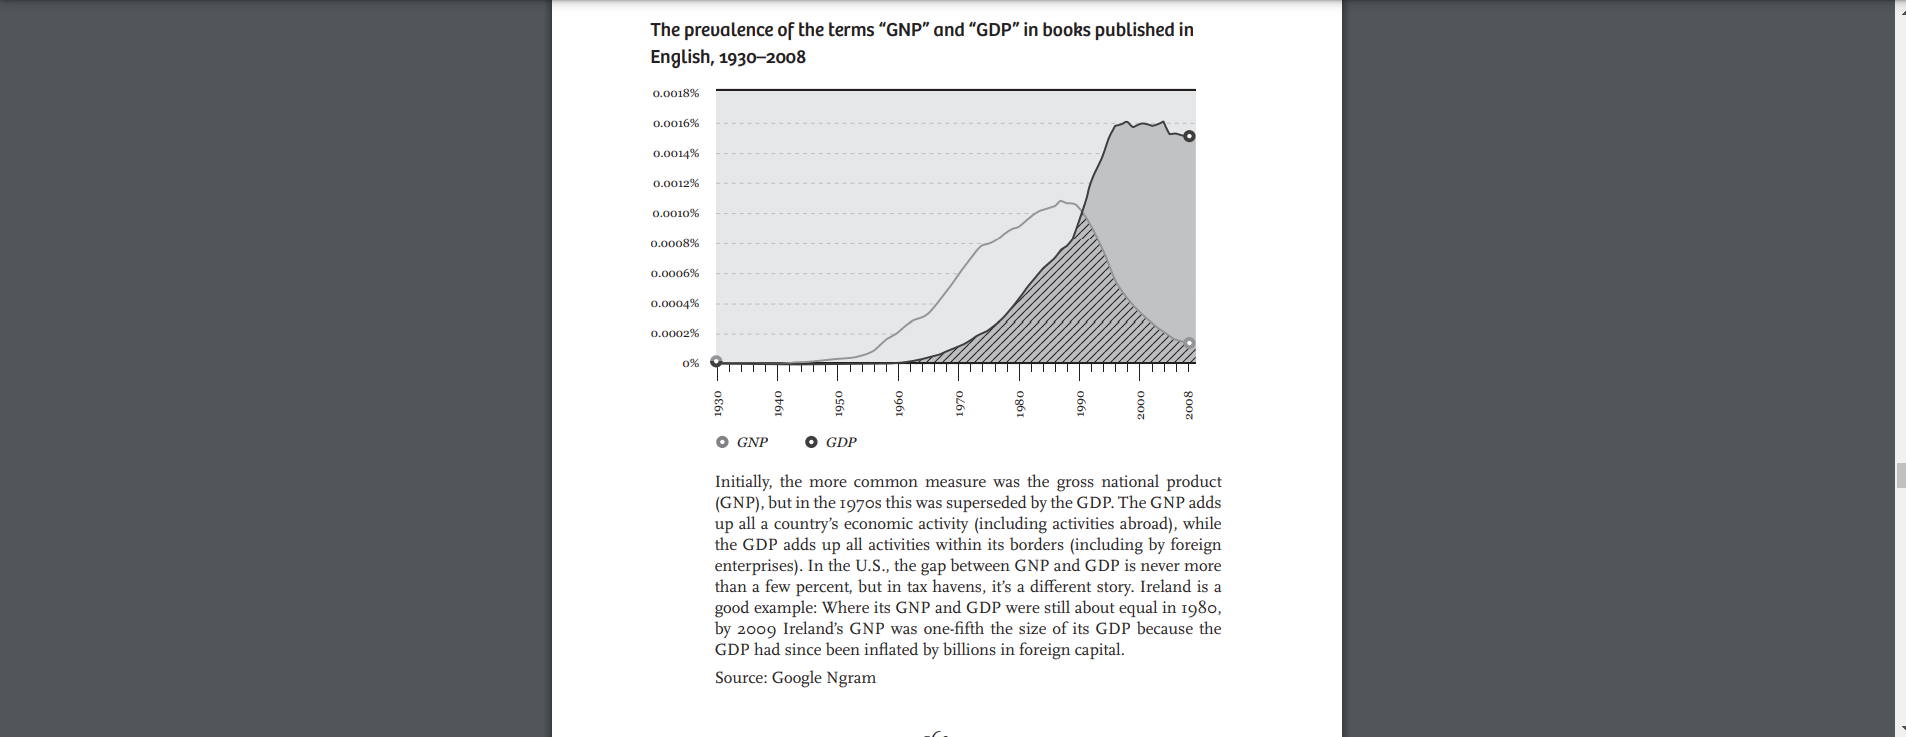
" It started at about a quarter to three in the afternoon - with tremors some six miles under the Earth's surface the likes of which hadn't been felt in half a century or more. Sixty miles away, seismographs started going crazy, scribbling a magnitude of 9 on the Richter scale. Less than half an hour later, the first waves crashed onto Japan's shore, towering 20, 40, even 60 feet high. In the space of a few hours, 150 square miles of land had been buried under mud, debris, and water. Nearly 20,000 people were left dead. "Japan's economy heads into freefall," a headline in Britain's The Guardian proclaimed shortly after the disaster.1 A few months later, the World Bank tallied the damage at $235 billion, on a par with the entire GDP of Greece. The Sendai seaquake on March 11, 2011, went down in history as the costliest disaster ever. But the story doesn't end there. In a TV appearance on the day of the quake, American economist Larry Summers said that, ironically, this tragedy would help to lift the Japanese economy. Sure, in the short run production would slow, but after a couple of months, recovery efforts would boost demand, employment, and consumption. And Larry Summers was right. After a slight dip in 2011, the following year saw the country's economy grow 2%, and figures for 2013 were even better. Japan was experiencing the effects of an enduring economic law which holds that every disaster has a silver lining - at least for the GDP. 154 It was the same with the Great Depression. The United States only really started to climb out of the crisis when it entered the biggest catastrophe of the last century: World War II. Or take the flood that killed almost 2,000 people in my own country of the Netherlands in 1953. Rebuilding after the disaster provided a terrific impetus for the Dutch economy. With national industry in a slump in the early 1950s, the inundation of large parts of the southwest buoyed annual growth from 2% to 8%. "We pulled ourselves up out of the muck by our bootstraps," one historian summed it up.2 What You See So should we welcome climate disasters? Raze entire neighborhoods? Blow up factories? It could be a great antidote to unemployment and work wonders for the economy. But before we get too excited, not everyone would agree with this line of thinking. In 1850, the philosopher Frdric Bastiat penned an essay titled "Ce qu'on voit et ce qu'on ne voit pas," which means roughly "What you see and what you don't."3 From a certain perspective, he says, breaking a window sounds like a fine idea. "Imagine it costs six francs to repair the damage. And imagine that this creates a commercial gain of six francs - I confess, there's no arguing with this reasoning. The glazier comes along, does his work, and happily pockets six francs..." Ce qu'on voit. But, as Bastiat realized, this theory doesn't take account of what we don't see. Imagine (again), that the Attorney General's Office reports a 15% increase in street activity. It's only natural that you'd want to know what kind of activity. Neighborhood barbecues or public nudity? Street musicians or street robberies? Lemonade stands or broken windows? What's the nature of the activity? That is precisely what modern society's sacred measure of progress, the Gross Domestic Product, does not measure. Ce qu'on ne voit pas.
What You Don't See The Gross Domestic Product. So, what is it really? Well, that's easy, you say: The GDP is the sum of all goods and services that a country produces, corrected for seasonal fluctuations, inflation, and perhaps purchasing power. To which Bastiat would respond: You've overlooked a huge part of the picture. Community service, clean air, free refills on the house - none of these things make the GDP an iota bigger. If a businesswoman marries her cleaner, the GDP dips when her hubby trades his job for unpaid housework. Or take Wikipedia. Supported by investments of time rather than money, it has left the old Encyclopedia Britannica in the dust - and taken the GDP down a few notches in the process. Some countries do factor in an estimate of their shadow economies. The Greek GDP spiked 25% when statisticians dove into the country's black market in 2006, for instance, thereby enabling the government to take out several hefty loans shortly before the European debt crisis broke out. Italy started including its black market back in 1987, which swelled its economy by 20% overnight. "A wave of euphoria swept over Italians," reported The New York Times, "after economists recalibrated their statistics taking into account for the first time the country's formidable underground economy of tax evaders and illegal workers."4 And that's to say nothing of all the unpaid labor that doesn't even qualify as part of the black market, from volunteering to child care to cooking, which together represents more than half of all our work. Of course, we can hire cleaners or nannies to do some of these chores, in which case they count toward the GDP, but we still do most ourselves. Adding all this unpaid work would expand the economy by anywhere from 37% (in Hungary) to 74% (in the UK).5 However, as the economist Diane Coyle notes, "generally official statistical agencies have never bothered - perhaps because it has been carried out mainly by women."6 156 While we're on the subject, only Denmark has ever attempted to quantify the value of breastfeeding in its GDP. And it's no paltry sum: In the U.S., the potential contribution of breast milk has been estimated at an incredible $110 billion a year7 - about the size of China's military budget.8 The GDP also does a poor job of calculating advances in knowledge. Our computers, cameras, and phones are all smarter, speedier, and snazzier than ever, but also cheaper, and therefore they scarcely figure.9 Where we still had to shell out $300,000 for a single storage gigabyte 30 years ago, today it costs less than a dime.10 Such stunning technological advances figure as little more than pocket change in the GDP. Free products can even cause the economy to contract (like the call service Skype, which cost telecom companies a fortune). Today, the average African with a cell phone has access to more information than President Clinton did in the 1990s, yet the information sector's share of the economy hasn't budged from 25 years ago, before we had the Internet.11 Besides being blind to lots of good things, the GDP also benefits from all manner of human suffering. Gridlock, drug abuse, adultery? Goldmines for gas stations, rehab centers, and divorce attorneys. If you were the GDP, your ideal citizen would be a compulsive gambler with cancer who's going through a drawn-out divorce that he copes with by popping fistfuls of Prozac and going berserk on Black Friday. Environmental pollution even does double duty: One company makes a mint by cutting corners while another is paid to clean up the mess. By contrast, a centuries-old tree doesn't count until you chop it down and sell it as lumber.12 Mental illness, obesity, pollution, crime - in terms of the GDP, the more the better. That's also why the country with the planet's highest per capita GDP, the United States, also leads in social problems. "By the standard of the GDP," says the writer Jonathan Rowe, "the worst families in America are those that actually function as families - that cook their own meals, take walks after din- 157 ner and talk together instead of just farming the kids out to the commercial culture."13 The GDP is equally indifferent to inequality, which is on the rise in most developed countries, and to debts, which make living on credit a tempting option. In the last quarter of 2008, when the global financial system very nearly imploded, British banks were growing faster than ever. As a share of the GDP, they represented 9% of the English economy at the height of the crisis, almost as much as the whole manufacturing industry. And to think that in the 1950s their contribution was still virtually nil. It was during the 1970s that statisticians decided it would be a good idea to measure banks' "productivity" in terms of their risk-taking behavior. The more risk, the bigger their slice of the GDP.14 Hardly any wonder, then, that banks have continually upped their lending, egged on by politicians who have been convinced that the financial sector's slice is every bit as valuable as the whole manufacturing industry. "If banking had been subtracted from the GDP, rather than added to it," The Financial Times recently reported, "it is plausible to speculate that the financial crisis would never have happened."15 The CEO who recklessly hawks mortgages and derivatives to lap up millions in bonuses currently contributes more to the GDP than a school packed with teachers or a factory full of car mechanics. We live in a world where the going rule seems to be that the more vital your occupation (cleaning, nursing, teaching), the lower you rate in the GDP. As the Nobel laureate James Tobin said back in 1984, "We are throwing more and more of our resources, including the cream of our youth, into financial activities remote from the production of goods and services, into activities that generate high private rewards disproportionate to their social productivity."16.
To Each Era Its Own Figures Don't get me wrong - in plenty of countries economic growth, welfare, and health still go happily hand in hand. These are places where there are still stomachs to fill and houses to build. It's a privilege of the rich to rank other goals ahead of growth. But for most of the world's population, money takes the cake. "There is only one class in the community that thinks more about money than the rich," said Oscar Wilde, "and that is the poor."17 We, however, belong to the first category. Here in the Land of Plenty we have come to the end of a long and historic voyage. For more than 30 years now, growth has hardly made us better off, and in some cases quite the reverse. If we want a higher quality of life, we will have to take the first step in search of other means, and alternative metrics. The idea that the GDP still serves as an accurate gauge of social welfare is one of the most widespread myths of our times. Even The growth of the banking sector 100 75 50 25 0 Bank accounts as a % of GDP Europe United States Japan 1900 1920 1940 1960 1980 2000 This graph shows lending to households and organizations outside the financial sector. "Europe" is the mean of Denmark, England, France, Germany, Italy, the Netherlands, Spain, and Sweden. Source: Schularick and Taylor (2012) 159 politicians who fight over everything else can always agree that the GDP must grow. Growth is good. It's good for employment, it's good for purchasing power, and it's good for our government, giving it more to spend. Modern journalism would be all but lost without the GDP, wielding the latest national growth figures as a kind of government report card. A shrinking GDP spells recession, and if it really shrivels, depression. In fact, the GDP offers pretty much everything a journalist could want: hard figures, issued at regular intervals, and the chance to quote experts. Most importantly, the GDP offers a clear benchmark. Is the government doing its job? How do we as a country stack up? Has life gotten a little better? Never fear, we have the latest figures on the GDP, and they'll tell us everything we need to know. Given our obsession with it, it's hard to believe that just 80 years ago the GDP didn't even exist. Of course, the desire to measure wealth goes way back, all the way back to the era of powdered wigs. Economists in those days, who were known as "Physiocrats," believed that all wealth came from the land. Consequently, they were preoccupied mainly with harvest yields. In 1665, the Englishman William Petty was the first to present an estimate of what he termed the "national income." His purpose was to discover how much England could raise in tax revenues, and, by extension, how long it could continue to finance war with Holland. Unlike the Physiocrats, Petty believed that true wealth derived not from the land, but from wages. Therefore, he reasoned, wages should be taxed more heavily. (Petty, as it happens, was a rich landowner.) A different definition of national income was advanced by the British politician Charles Davenant, who gives the game away in the title of his 1695 essay "Upon Ways And Means Of Supplying The War." Estimates like his gave England a considerable advantage as it vied against France. The French king, for his part, had to wait until the end of the 18th century to get decent economic 160 statistics of his own. In 1781 his finance minister, Jacques Necker, submitted the Compte rendu au roi, or "financial statement for the king," to Louis XVI, who was then already teetering on the brink of bankruptcy. Although this document enabled the king to take out a few more loans, it came too late to stop the Revolution in 1789. The meaning of the term "national income" has actually never been fixed, fluctuating with the latest intellectual currents and the imperatives of the moment. Every era has its own idiosyncratic ideas about what defines a country's wealth. Take Adam Smith, father of modern economics, who believed that the wealth of nations was founded not only on agriculture, but also manufacturing. The entire service economy, by contrast - a sector that spans everything from entertainers to lawyers and constitutes roughly two-thirds of the modern economy - Smith argued "adds to the value of nothing."18 Nevertheless, as cash flows shifted from farms to factories and then from production lines to office towers, figures for tabulating all this wealth kept pace. The first person to argue that what matters is not the nature but the price of products was the economist Alfred Marshall (1842-1924). By Marshall's measure, a Paris Hilton movie, an hour of Jersey Shore, and a Bud Light Lime can all boost a country's wealth, as long as they carry a price tag. Yet just 80 years ago it still seemed an impossible mission when U.S. President Herbert Hoover was tasked with beating back the Great Depression with only a mixed bag of numbers, ranging from share values to the price of iron to the volume of road transport. Even his most important metric - the "blastfurnace index" - was little more than an unwieldy construct that attempted to pin down production levels in the steel industry. If you had asked Hoover how "the economy" was doing, he would have given you a puzzled look. Not only because this wasn't among the numbers in his bag, but because he would have had no notion of our modern understanding of the word "economy." 161 "Economy" isn't really a thing, after all - it's an idea, and that idea had yet to be invented. In 1931, Congress called together the country's leading statisticians and found them unable to answer even the most basic questions about the state of the nation. That something was fundamentally wrong seemed evident, but their last reliable figures dated from 1929. It was obvious that the homeless population was growing and that companies were going bankrupt left and right, but as to the actual extent of the problem, nobody knew. A few months earlier, President Hoover had dispatched a number of Commerce Department employees around the country to report on the situation. They returned with mainly anecdotal evidence that aligned with Hoover's own belief that economic recovery was just around the bend. Congress wasn't reassured, however. In 1932, it appointed a brilliant young Russian professor by the name of Simon Kuznets to answer a simple question: How much stuff can we make? Over the next few years, Kuznets laid the foundations of what would later become the GDP. His initial calculations caused a flurry of excitement and the report he presented to Congress became a national bestseller (itself adding to the GDP, one 20-cent copy at a time). Soon, you couldn't switch on the radio without hearing about "national income" this or "the economy" that. It's hard to overstate the importance of the GDP. Even the atomic bomb pales in comparison, according to some historians. The GDP, it turned out, was an excellent yardstick for the power of a nation in times of war. "Only those who had a personal share in the economic mobilization for World War I could realize in how many ways and how much estimates of national income covering 20 years and classified in several ways facilitated the World War II effort," U.S. National Bureau of Economic Research Director Wesley C. Mitchell wrote shortly after the war.19 Solid figures can even tip the balance between life and death. In his 1940 essay "How to Pay for the War," Keynes complained of 162 spotty British statistics. Hitler likewise lacked the figures needed to get the German economy back up to speed. It wasn't until 1944, as the Russians bore down on the Eastern Front and the Allies landed in the west, that the German economy achieved peak production.20 But by that time, the American GDP - the measurement of which would eventually earn Kuznets the Nobel Prize - had already won the day. The Ultimate Yardstick From the wreckage of depression and war, the GDP emerged as the ultimate yardstick of progress - the crystal ball of nations, the number to trump all others. And this time, its job was not to bolster the war effort, but to anchor the consumer society. "Much like a satellite in space can survey the weather across an entire continent so can the GDP give an overall picture of the state of the economy," economist Paul Samuelson wrote in his bestselling textbook Economics. "Without measures of economic aggregates like GDP, policymakers would be adrift in a sea of unorganized data," he continued. "The GDP and related data are like beacons that help policymakers steer the economy toward the key economic objectives."21 At the start of the 20th century the U.S. government employed a grand total of one economist; more accurately, an "economic ornithologist," whose job was to study birds. Less than 40 years later, the National Bureau of Economic Research payrolled some 5,000 economists, in the sense that we use the word. These included Simon Kuznets and Milton Friedman, ultimately two of the century's most important thinkers.22 All across the world, economists began to play a dominant role in politics. Most were educated in the United States, the cradle of the GDP, where practitioners pursued a new, scientific brand of economics revolving around models, 163 equations, and numbers. Lots and lots of numbers. This was a completely different form of economics to what John Maynard Keynes and Friedrich Hayek had learned at school. When people around 1900 talked about "the economy," they usually just meant "society." But the 1950s introduced a new generation of technocrats who invented a whole new objective: getting the "economy" to "grow." More important, they thought they knew how to accomplish it. Before the invention of the GDP, economists were rarely quoted.
by the press, but in the years after WWII they became a fixture in the papers. They had mastered a trick no one else could do: managing reality and predicting the future. Increasingly, the economy was regarded as a machine with levers that politicians could pull to promote "growth." In 1949, the inventor and economist Bill Phillips even constructed a real machine from plastic containers and pipes to represent the economy, with water pumping around to represent federal revenue flows. As one historian explains, "The first thing you do in 1950s and '60s if you're a new nation is you open a national airline, you create a national army, and you start measuring GDP."23 But that last item became progressively trickier. When the United Nations published its first standard guideline for figuring GDP in 1953, it totaled just under 50 pages. The most recent edition, issued in 2008, comes in at 722. Though it's a number bandied about freely in the media, there are few people who really understand how the GDP is determined. Even many professional economists have no clue.24 To calculate the GDP, numerous data points have to be linked together and hundreds of wholly subjective choices made regarding what to count and what to ignore. In spite of this methodology, the GDP is never presented as anything less than hard science, whose fractional vacillations can make the difference between reelection and political annihilation. Yet this apparent precision is an illusion. The GDP is not a clearly defined object just waiting around to be "measured." To measure GDP is to seek to measure an idea. A great idea, admittedly. There's no denying that GDP came in very handy during wartime, when the enemy was at the gates and a country's very existence hinged on production, on churning out as many tanks, planes, bombs, and grenades as possible. During wartime, it's perfectly reasonable to borrow from the future. During wartime, it makes sense to pollute the environment and go into debt. It can even be preferable to neglect your family, put your children to work on a production line, sacrifice your free time, and forget everything that makes life worth living. 165 Indeed, during wartime, there's no metric quite as useful as the GDP. Alternatives The point, of course, is that the war is over. Our standard of progress was conceived for a different era with different problems. Our statistics no longer capture the shape of our economy. And this has consequences. Every era needs its own figures. In the 18th century, they concerned the size of the harvest. In the 19th century, the radius of the rail network, the number of factories, and the volume of coal mining. And in the 20th, industrial mass production within the boundaries of the nation-state. But today it's no longer possible to express our prosperity in simple dollars, pounds, or euros. From healthcare to education, from journalism to finance, we're all still fixated on "efficiency" and "gains," as though society were nothing but one big production line. But it's precisely in a service-based economy that simple quantitative targets fail. "The gross national product [...] measures everything [...] except that which makes life worthwhile," said Robert Kennedy.25 It's time for a new set of figures. As long ago as 1972, the Fourth Dragon King of Bhutan proposed a switch to measuring "gross national happiness," since GDP ignored vital facets of culture and well-being (for starters, knowledge of traditional songs and dances). But happiness seems no less one-dimensional and arbitrary a quality to quantify than GDP; after all, you could be happy just because you're three sheets to the wind - ce qu'on ne voit pas. And don't setbacks, sorrow, and sadness have a place in a full life, too? It's like the philosopher John Stuart Mill once said: "Better to be Socrates dissatisfied than a fool satisfied." Not only that, we need a good dose of irritation, frustration, and 166 discontent to propel us forward. If the Land of Plenty is a place where everybody is happy, then it's also a place steeped in apathy. Had women never protested, they would never have gained the vote; had African Americans never rebelled, Jim Crow might still be the law of the land. If we prefer to salve our grievances with a fixation on gross national happiness, that would spell the end of progress. "Discontent," said Oscar Wilde, "is the first step in the progress of a man or a nation." So how about some other options? Two candidates are the Genuine Progress Indicator (GPI) and the Index of Sustainable Economic Welfare (ISEW), which also incorporate pollution, crime, inequality, and volunteer work in their equations. In Western Europe, GPI has advanced a good deal slower than GDP, and in the U.S. it has even receded since the 1970s. Or how about the Happy Planet Index, a ranking that factors in ecological footprints, in which most developed countries figure somewhere around the middle and the U.S. dangles near the bottom. But even these calculations leave me skeptical. Bhutan rocks the charts in its own index, which conveniently leaves out the Dragon King's dictatorship and the ethnic cleansing of the Lhotshampa. Communist East Germany had a "gross social product" that rose steadily year after year despite the massive social, ecological, and economic harms perpetrated by the regime. Likewise, though GPI and ISEW do correct some of GDP's failings, they totally pass over the huge technological leaps made in recent decades. Both indices testify that all is not well in the world - but that's also precisely what they've been designed to show. In fact, simple rankings consistently conceal more than they reveal. A high score on the UN's Human Development Index or the OECD's Better Life Index may be something we should applaud, but not if we don't know what is being measured. What's certain is that the wealthier countries become, the more difficult is it to measure that wealth. Paradoxically, we're living in an informa- 167 tion age where we spend increasing amounts of money on activities about which we have little solid information. The Secret of the Expanding Government It all goes back to Mozart. When the musical mastermind composed his 14th string quartet in G major (K. 387) in 1782, he needed four people to perform it. Now, 250 years later, it still requires exactly four.26 If you're looking to up your violin's production capacity, the most you can do is play a little faster. Put another way: Some things in life, like music, resist all attempts at greater efficiency. While wecan produce coffee machines ever faster and more cheaply, a violinist can't pick up the pace without spoiling the tune. In our race against the machine, it's only logical that we'll continue to spend less on products that can be easily made more efficiently and more on labor-intensive services and amenities such as art, healthcare, education, and safety. It's no accident that countries that score high on well-being, like Denmark, Sweden, and Finland, have a large public sector. Their governments subsidize the domains where productivity can't be leveraged. Unlike the manufacture of a fridge or a car, history lessons and doctor's checkups can't simply be made "more efficient."27 The natural consequence is that the government is gobbling up a growing share of the economic pie. First noted by the economist William Baumol in the 1960s, this phenomenon, now known as "Baumol's cost disease," basically says that prices in labor-intensive sectors such as healthcare and education increase faster than prices in sectors where most of the work can be more extensively automated. But hold on a minute. Shouldn't we be calling this a blessing, rather than a disease? After all, the more efficient our factories and our computers, the 168 less efficient our healthcare and education need to be; that is, the more time we have left to attend to the old and infirm and to organize education on a more personal scale. Which is great, right? According to Baumol, the main impediment to allocating our resources toward such noble ends is "the illusion that we cannot afford them." As illusions go, this one is pretty stubborn. When you're obsessed with efficiency and productivity, it's difficult to see the real value of education and care. Which is why so many politicians and taxpayers alike see only costs. They don't realize that the richer a country becomes the more it should be spending on teachers and doctors. Instead of regarding these increases as a blessing, they're viewed as a disease. Yet unless we prefer to run our schools and hospitals as if they were factories, we can be certain that, in the race against the machine, the costs of healthcare and education will only go up. At the same time, products like refrigerators and cars have become too cheap. To look solely at the price of a product is to ignore a large share of the costs. In fact, a British think tank calculated that for every pound earned by advertising executives, they destroy an equivalent of 7 in the form of stress, overconsumption, pollution, and debt; conversely, each pound paid to a trash collector creates an equivalent of 12 in terms of health and sustainability.28 Whereas public sector services often bring a plethora of hidden benefits, the private sector is riddled with hidden costs. "We can afford to pay more for the services we need - chiefly healthcare and education," Baumol writes. "What we may not be able to afford are the consequences of falling costs." You may brush this aside with the argument that such "externalities" can't simply be quantified because they involve too many subjective assumptions, but that's precisely the point. "Value" and "productivity" cannot be expressed in objective figures, even if we pretend the opposite: "We have a high graduation rate, therefore we offer a good education" - "Our doctors are focused and effi- 169 cient, therefore we provide good care" - "We have a high publication rate, therefore we are an excellent university" - "We have a high audience share, therefore we are producing good television" - "The economy is growing, therefore our country is doing fine..." The targets of our performance-driven society are no less absurd than the five-year plans of the former U.S.S.R. To found our political system on production figures is to turn the good life into a spreadsheet. As the writer Kevin Kelly says, "Productivity is for robots. Humans excel at wasting time, experimenting, playing, creating, and exploring."29 Governing by numbers is the last resort of a country that no longer knows what it wants, a country with no vision of utopia. A Dashboard for Progress "There are three kinds of lies: lies, damned lies, and statistics," a British prime minister purportedly scoffed. Nevertheless, I firmly believe in the old Enlightenment principle that decisions require a foundation of reliable information and numbers. The GDP was contrived in a period of deep crisis and provided an answer to the great challenges of the 1930s. As we face our own crises of unemployment, depression, and climate change, we, too, will have to search for a new figure. What we need is a "dashboard" complete with an array of indicators to track the things that make life worthwhile - money and growth, obviously, but also community service, jobs, knowledge, social cohesion. And, of course, the scarcest good of all: time. "But such a dashboard couldn't possibly be objective," you might counter. True. But there's no such thing as a neutral metric. Behind every statistic is a certain set of assumptions and prejudices. What's more, those figures - and their assumptions - guide our actions. That's true of GDP but equally true of the Human Development and Happy Planet indices. And it's precisely because we need to 170 change our actions that we need new figures to guide us. Simon Kuznets warned us about this 80 years ago. "The welfare of a nation can [...] scarcely be inferred from a measurement of national income," he reported to Congress. "Measurements of national income are subject to this type of illusion and resulting abuse, especially since they deal with matters that are the center of conflict of opposing social groups where the effectiveness of an argument is contingent upon oversimplification."30 The inventor of GDP cautioned against including in its calculation expenditure for the military, advertising, and financial sector,31 but his advice fell on deaf ears. After WWII, Kuznets grew increasingly concerned about the monster he had created. "Distinctions must be kept in mind between quantity and quality of growth," he wrote in 1962, "between costs and returns, and between the short and long run. Goals for more growth should specify more growth of what and for what."32 Now it's up to us to reconsider these old questions. What is growth? What is progress? or even more fundamentally, what makes life truly worthwhile?"

Step by Step Solution
There are 3 Steps involved in it

Get step-by-step solutions from verified subject matter experts