

Question: Comprehensive Case Study 1: AT&T Versus Verizon a Financial Comparison 1.) What are some trends that you see in the overall wireless and wireline industry?
Comprehensive Case Study 1: AT&T Versus Verizon a Financial Comparison
1.) What are some trends that you see in the overall wireless and wireline industry? (growth, profitability, # of subscribers, growth, etc.) Will wireline communication networks eventually disappear, will wireless?? Describe the overall strategy for each firm and what you expect to see going forward based on your analysis of their financials.
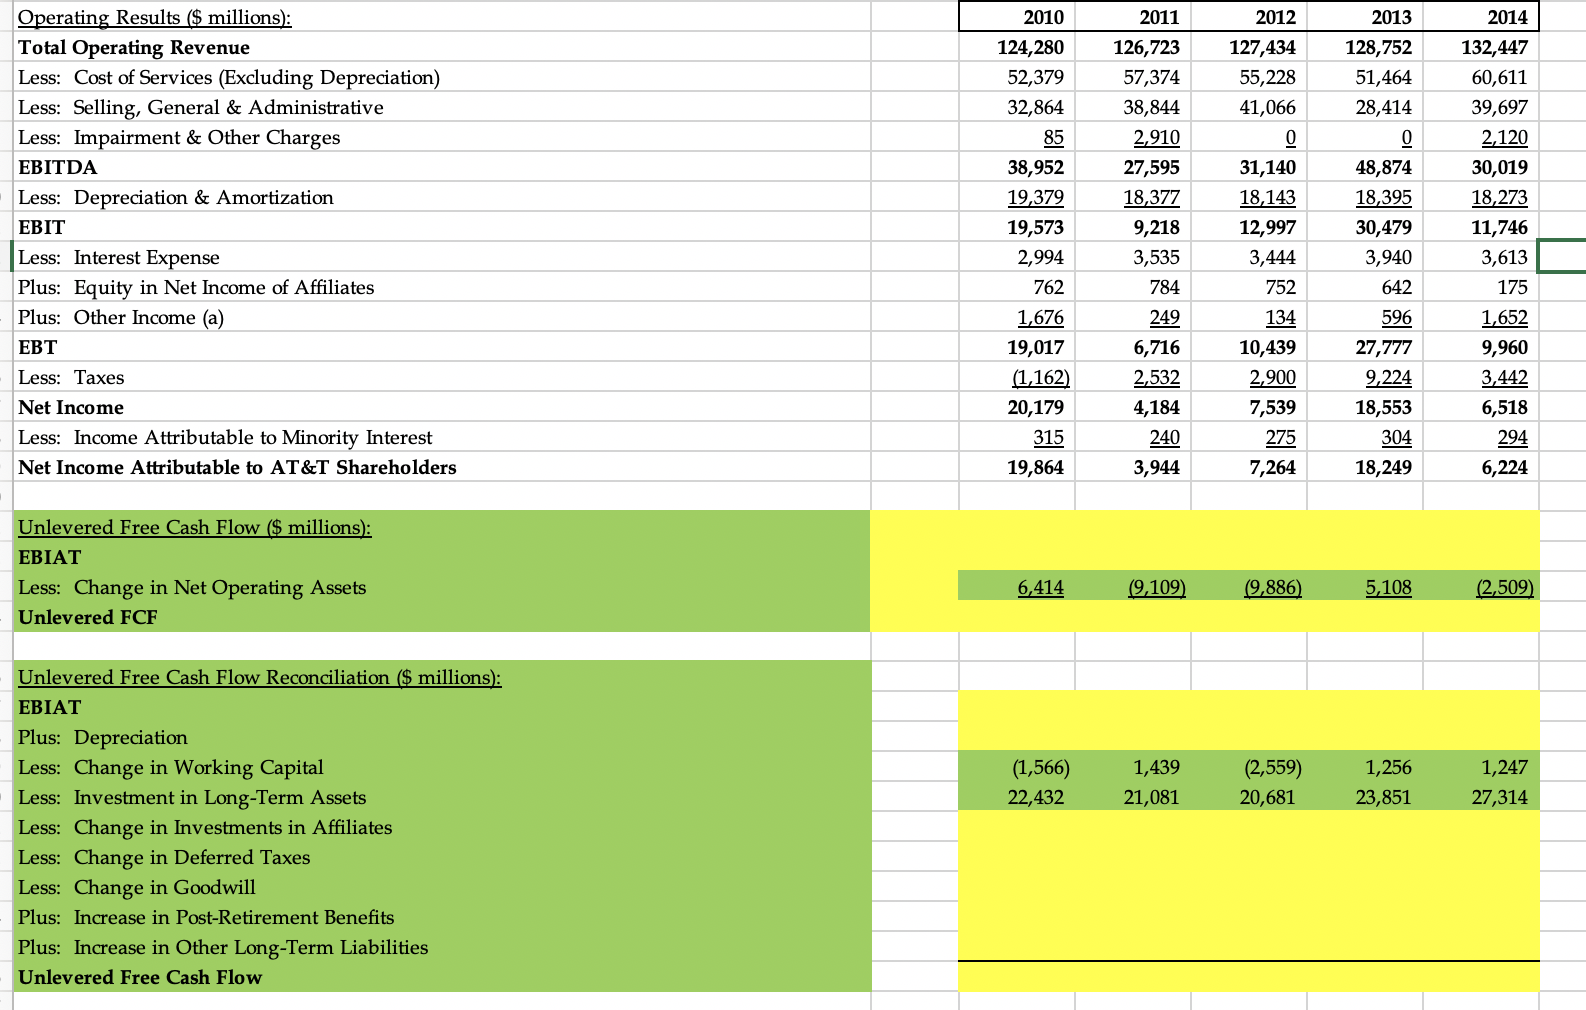
2.) Calculate the unlevered free cash flow reconciliation and unlevered free cash flow reconciliation sections for each firm using exhibits 1A and 2A income statements from both firms to complete
3.) For each company, consider the consolidated financial results and provide a margin analysis including (revenue growth, EBIT margin, EBITDA Margin, Tax Rate, Net Income Margin, and unlevered Free Cash Flow.
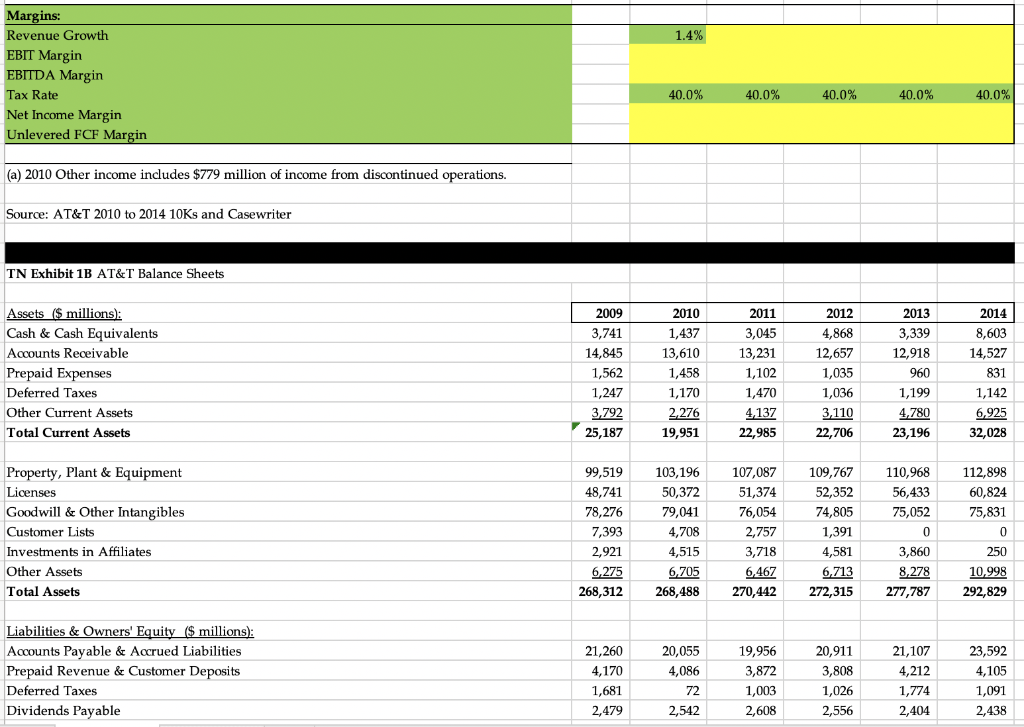
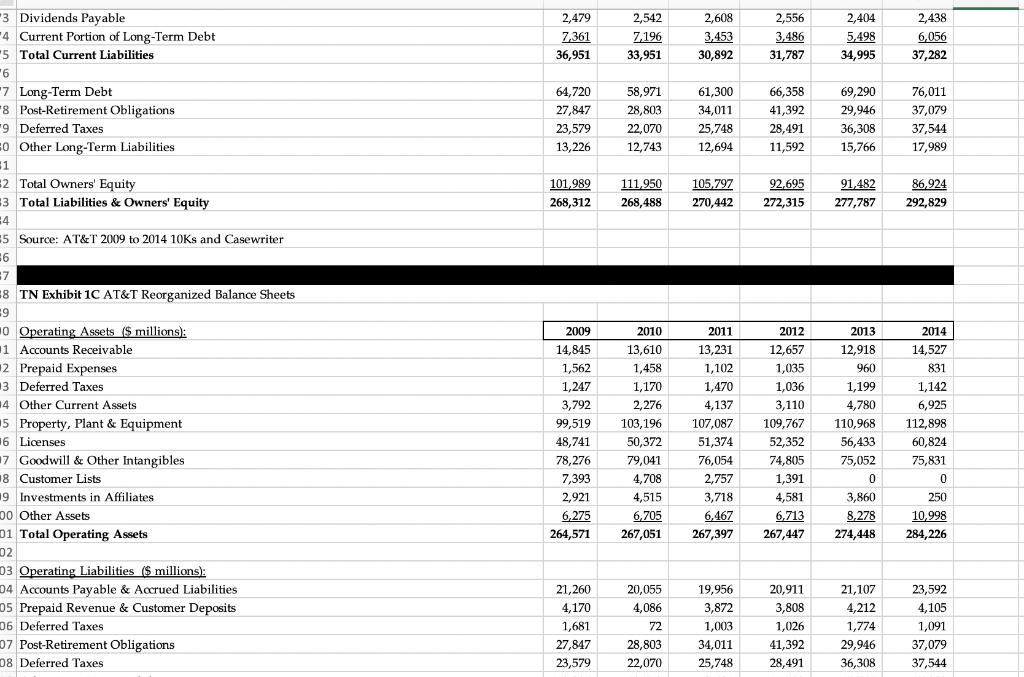
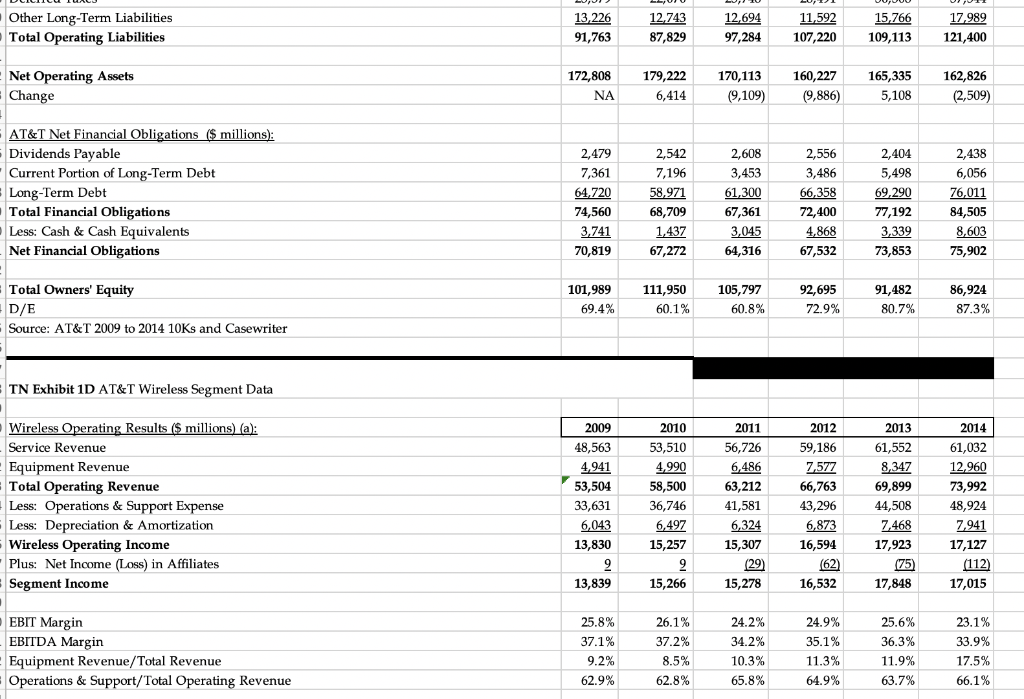
4.) After reading and analysis of the financials has either, or both companies been reinvesting in its business, provide some evidence to this?
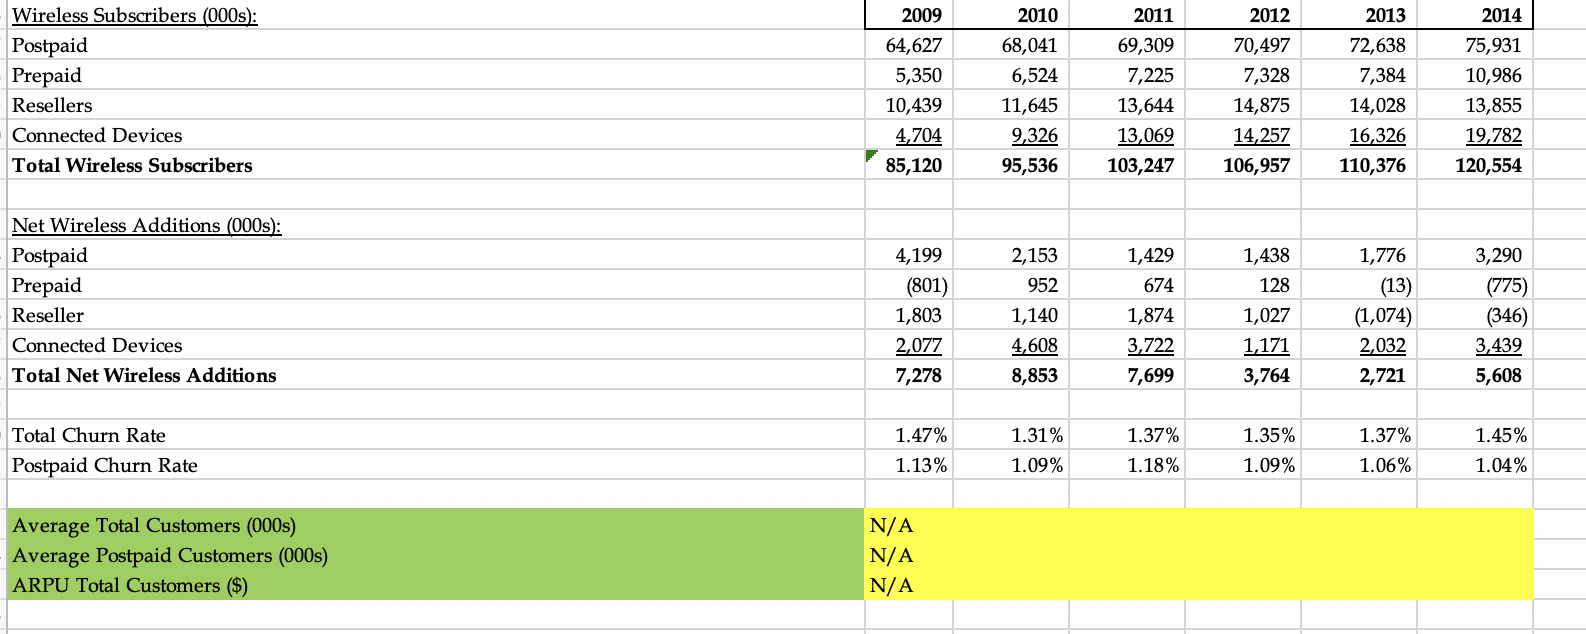
5.) For each firm discuss what the trend in postpaid wireless subscribers (ATT) and total wireless subscribers (Verizon) are after calculating what the average revenue per user is (ARPU)?
6.) After reading and some analysis done already discuss the profitability of ATT versus that of Verizon? Give one financial calculation that you can point to that illustrates this.
2010 124,280 52,379 32,864 2013 128,752 51,464 28,414 85 0 Operating Results ($ millions): Total Operating Revenue Less: Cost of Services (Excluding Depreciation) Less: Selling, General & Administrative Less: Impairment & Other Charges EBITDA Less: Depreciation & Amortization EBIT Less: Interest Expense Plus: Equity in Net Income of Affiliates Plus: Other Income (a) Less: Taxes Net Income Less: Income Attributable to Minority Interest Net Income Attributable to AT&T Shareholders 2011 126,723 57,374 38,844 2,910 27,595 18,377 9,218 3,535 784 249 6,716 2,532 4,184 2012 127,434 55,228 41,066 0 31,140 18,143 12,997 3,444 752 38,952 19,379 19,573 2,994 762 1,676 19,017 (1,162) 20,179 315 19,864 2014 132,447 60,611 39,697 2,120 30,019 18,273 11,746 3,613 175 1,652 9,960 3,442 6,518 48,874 18,395 30,479 3,940 642 596 27,777 9,224 18,553 304 18,249 134 10,439 2,900 7,539 275 7,264 240 294 3,944 6,224 Unlevered Free Cash Flow ($ millions): EBIAT Less: Change in Net Operating Assets Unlevered FCF 6,414 9,109) (9,886) 5,108 (2,509) (1,566) 22,432 1,439 21,081 (2,559) 2 0,681 1,256 23,851 1,247 27,314 Unlevered Free Cash Flow Reconciliation ($ millions): EBIAT Plus: Depreciation Less: Change in Working Capital Less: Investment in Long-Term Assets Less: Change in Investments in Affiliates Less: Change in Deferred Taxes Less: Change in Goodwill Plus: Increase in Post-Retirement Benefits Plus: Increase in Other Long-Term Liabilities Unlevered Free Cash Flow 1.4% Margins: Revenue Growth EBIT Margin EBITDA Margin Tax Rate Net Income Margin Unlevered FCF Margin 40.0% 40.0% 40.0% 40.0% 40.0% (a) 2010 Other income includes $779 million of income from discontinued operations. Source: AT&T 2010 to 2014 10Ks and Casewriter TN Exhibit 1B AT&T Balance Sheets 2009 3,741 Assets ($ millions): Cash & Cash Equivalents Accounts Receivable Prepaid Expenses Deferred Taxes Other Current Assets Total Current Assets 2010 1,437 13,610 1,458 1,170 2,276 19,951 14,845 1,562 1,247 3,792 25,187 2011 3,045 13,231 1,102 1,470 4,137 22,985 2012 4,868 12,657 1,035 1,036 3,110 22,706 2013 3,339 12,918 960 1,199 4,780 23,196 2014 8,603 14,527 831 1,142 6,925 32,028 112,898 60,824 75,831 Property, Plant & Equipment Licenses Goodwill & Other Intangibles Customer Lists Investments in Affiliates Other Assets Total Assets 99,519 48,741 78,276 7,393 2,921 6,275 268,312 103,196 50,372 79,041 4,708 4,515 6,705 268,488 107,087 51,374 76,054 2,757 3,718 6,467 270,442 109,767 52,352 74,805 1,391 4,581 6,713 272,315 110,968 56,433 75,052 0 3,860 8,278 277,787 250 10,998 292,829 Liabilities & Owners' Equity ($ millions): Accounts Payable & Accrued Liabilities Prepaid Revenue & Customer Deposits Deferred Taxes Dividends Payable 20,055 4,086 21,260 4,170 1,681 2,479 19,956 3,872 1,003 2,608 20,911 3,808 1,026 2,556 21,107 4,212 1,774 2,404 23,592 4,105 1,091 2,438 72 2,542 "3 Dividends Payable *4 Current Portion of Long-Term Debt "5 Total Current Liabilities 2,479 7,361 36,951 2,542 7,196 33,951 2,608 3,453 30,892 2,556 3,486 31,787 2,404 5,498 34,995 2,438 6,056 37,282 *7 Long-Term Debt "8 Post-Retirement Obligations -9 Deferred Taxes 0 Other Long-Term Liabilities 64,720 27,847 23,579 13,226 58,971 28,803 22,070 12,743 61,300 34,011 25,748 12,694 66,358 41,392 28,491 11,592 69,290 29,946 36,308 15,766 76,011 37,079 37,544 17,989 2 Total Owners' Equity 3 Total Liabilities & Owners' Equity 101,989 268,312 111,950 268,488 105,797 270,442 92,695 272,315 91,482 277,787 86,924 292,829 5 Source: AT&T 2009 to 2014 10ks and Casewriter 18 TN Exhibit 1C AT&T Reorganized Balance Sheets 10 Operating Assets ($ millions): 11 Accounts Receivable 12 Prepaid Expenses 13 Deferred Taxes 14 Other Current Assets 15 Property, Plant & Equipment 16 Licenses 17 Goodwill & Other Intangibles 18 Customer Lists 19 Investments in Affiliates 00 Other Assets 01 Total Operating Assets 2009 14,845 1,562 1,247 3,792 99,519 48,741 78,276 7,393 2,921 6,275 264,571 2010 13,610 1,458 1,170 2,276 103,196 50,372 79,041 4,708 4,515 6,705 267,051 2011 13,231 1,102 1,470 4,137 107,087 51,374 76,054 2,757 3,718 6,467 267,397 2012 12,657 1,035 1,036 3,110 109,767 52,352 74,805 1,391 4,581 6,713 267,447 2013 12,918 960 1,199 4,780 110,968 56,433 75,052 2014 14,527 831 1,142 6,925 112,898 60,824 75,831 0 250 10,998 284,226 3,860 8,278 274,448 02 20,055 4,086 03 Operating Liabilities ($ millions): 04 Accounts Payable & Accrued Liabilities 05 Prepaid Revenue & Customer Deposits 06 Deferred Taxes 07 Post-Retirement Obligations 08 Deferred Taxes 21,260 4,170 1,681 27,847 23,579 19,956 3,872 1,003 34,011 25,748 20,911 3,808 1,026 41,392 28,491 21,107 4,212 1,774 29,946 36,308 23,592 4,105 1,091 37,079 37,544 28,803 22,070 Other Long-Term Liabilities Total Operating Liabilities 13,226 91,763 12,743 87,829 12,694 97,284 11,592 107,220 15,766 109,113 17,989 121,400 Net Operating Assets Change 172,808 NA 179,222 6,414 170,113 (9,109) 160,227 (9,886) 165,335 5,108 162,826 (2,509) AT&T Net Financial Obligations ($ millions): Dividends Payable Current Portion of Long-Term Debt Long-Term Debt Total Financial Obligations Less: Cash & Cash Equivalents Net Financial Obligations 2,479 7,361 64,720 74,560 3,741 70,819 2,542 7,196 58,971 68,709 1,437 67,272 2,608 3,453 61,300 67,361 3,045 64,316 2,556 3,486 66,358 72,400 4,868 67,532 2,404 5,498 69,290 77,192 3,339 73,853 2,438 6,056 76,011 84,505 8,603 75,902 Total Owners' Equity D/E Source: AT&T 2009 to 2014 10Ks and Casewriter 101,989 69.4% 111,950 60.1% 105,797 60.8% 92,695 72.9% 91,482 80.7% 86,924 87.3% TN Exhibit 1D AT&T Wireless Segment Data Wireless Operating Results ($ millions) (a): Service Revenue Equipment Revenue Total Operating Revenue Less: Operations & Support Expense -Less: Depreciation & Amortization Wireless Operating Income Plus: Net Income (Loss) in Affiliates Segment Income 2009 48,563 4,941 53,504 33,631 6,043 13,830 2010 53,510 4,990 58,500 36,746 6,497 15,257 2011 56,726 6,486 63,212 41,581 6,324 15,307 (29 15,278 2012 59,186 7,577 66,763 43,296 6,873 16,594 (62) 16,532 2013 61,552 8,347 69,899 44,508 7,468 17,923 2014 61,032 12,960 73,992 48,924 7,941 17,127 (112) 17,015 13,839 15,266 17,848 EBIT Margin EBITDA Margin - Equipment Revenue/Total Revenue Operations & Support/Total Operating Revenue 25.8% 37.1% 9.2% 62.9% 26.1% 37.2% 8.5% 62.8% 24.2% 34.2% 10.3% 65.8% 24.9% 35.1% 11.3% 64.9% 25.6% 36.3% 11.9% 63.7% 23.1% 33.9% 17.5% 66.1% Wireless Subscribers (000s): Postpaid Prepaid Resellers Connected Devices Total Wireless Subscribers 2009 64,627 5,350 10,439 4,704 85,120 2010 68,041 6,524 11,645 9,326 95,536 2011 69,309 7,225 13,644 13,069 103,247 2012 70,497 7,328 14,875 14,257 106,957 2013 72,638 7,384 14,028 16,326 110,376 2014 75,931 10,986 13,855 19,782 120,554 Net Wireless Additions (000s): Postpaid Prepaid Reseller Connected Devices Total Net Wireless Additions 4,199 (801) 1,803 2,077 7,278 2,153 952 1,140 4,608 8,853 1,429 674 1,874 3,722 7,699 1,438 128 1,027 1,171 3,764 1,776 (13) (1,074) 2,032 2,721 3,290 (775) (346) 3,439 5,608 Total Churn Rate Postpaid Churn Rate 1.47% 1.13% 1.31% 1.09% 1.37% 1.18% 1.35% 1.09% 1.37% 1.06% 1.45% 1.04% Average Total Customers (000s) Average Postpaid Customers (000s) ARPU Total Customers ($) N/A N/A N/A 2010 124,280 52,379 32,864 2013 128,752 51,464 28,414 85 0 Operating Results ($ millions): Total Operating Revenue Less: Cost of Services (Excluding Depreciation) Less: Selling, General & Administrative Less: Impairment & Other Charges EBITDA Less: Depreciation & Amortization EBIT Less: Interest Expense Plus: Equity in Net Income of Affiliates Plus: Other Income (a) Less: Taxes Net Income Less: Income Attributable to Minority Interest Net Income Attributable to AT&T Shareholders 2011 126,723 57,374 38,844 2,910 27,595 18,377 9,218 3,535 784 249 6,716 2,532 4,184 2012 127,434 55,228 41,066 0 31,140 18,143 12,997 3,444 752 38,952 19,379 19,573 2,994 762 1,676 19,017 (1,162) 20,179 315 19,864 2014 132,447 60,611 39,697 2,120 30,019 18,273 11,746 3,613 175 1,652 9,960 3,442 6,518 48,874 18,395 30,479 3,940 642 596 27,777 9,224 18,553 304 18,249 134 10,439 2,900 7,539 275 7,264 240 294 3,944 6,224 Unlevered Free Cash Flow ($ millions): EBIAT Less: Change in Net Operating Assets Unlevered FCF 6,414 9,109) (9,886) 5,108 (2,509) (1,566) 22,432 1,439 21,081 (2,559) 2 0,681 1,256 23,851 1,247 27,314 Unlevered Free Cash Flow Reconciliation ($ millions): EBIAT Plus: Depreciation Less: Change in Working Capital Less: Investment in Long-Term Assets Less: Change in Investments in Affiliates Less: Change in Deferred Taxes Less: Change in Goodwill Plus: Increase in Post-Retirement Benefits Plus: Increase in Other Long-Term Liabilities Unlevered Free Cash Flow 1.4% Margins: Revenue Growth EBIT Margin EBITDA Margin Tax Rate Net Income Margin Unlevered FCF Margin 40.0% 40.0% 40.0% 40.0% 40.0% (a) 2010 Other income includes $779 million of income from discontinued operations. Source: AT&T 2010 to 2014 10Ks and Casewriter TN Exhibit 1B AT&T Balance Sheets 2009 3,741 Assets ($ millions): Cash & Cash Equivalents Accounts Receivable Prepaid Expenses Deferred Taxes Other Current Assets Total Current Assets 2010 1,437 13,610 1,458 1,170 2,276 19,951 14,845 1,562 1,247 3,792 25,187 2011 3,045 13,231 1,102 1,470 4,137 22,985 2012 4,868 12,657 1,035 1,036 3,110 22,706 2013 3,339 12,918 960 1,199 4,780 23,196 2014 8,603 14,527 831 1,142 6,925 32,028 112,898 60,824 75,831 Property, Plant & Equipment Licenses Goodwill & Other Intangibles Customer Lists Investments in Affiliates Other Assets Total Assets 99,519 48,741 78,276 7,393 2,921 6,275 268,312 103,196 50,372 79,041 4,708 4,515 6,705 268,488 107,087 51,374 76,054 2,757 3,718 6,467 270,442 109,767 52,352 74,805 1,391 4,581 6,713 272,315 110,968 56,433 75,052 0 3,860 8,278 277,787 250 10,998 292,829 Liabilities & Owners' Equity ($ millions): Accounts Payable & Accrued Liabilities Prepaid Revenue & Customer Deposits Deferred Taxes Dividends Payable 20,055 4,086 21,260 4,170 1,681 2,479 19,956 3,872 1,003 2,608 20,911 3,808 1,026 2,556 21,107 4,212 1,774 2,404 23,592 4,105 1,091 2,438 72 2,542 "3 Dividends Payable *4 Current Portion of Long-Term Debt "5 Total Current Liabilities 2,479 7,361 36,951 2,542 7,196 33,951 2,608 3,453 30,892 2,556 3,486 31,787 2,404 5,498 34,995 2,438 6,056 37,282 *7 Long-Term Debt "8 Post-Retirement Obligations -9 Deferred Taxes 0 Other Long-Term Liabilities 64,720 27,847 23,579 13,226 58,971 28,803 22,070 12,743 61,300 34,011 25,748 12,694 66,358 41,392 28,491 11,592 69,290 29,946 36,308 15,766 76,011 37,079 37,544 17,989 2 Total Owners' Equity 3 Total Liabilities & Owners' Equity 101,989 268,312 111,950 268,488 105,797 270,442 92,695 272,315 91,482 277,787 86,924 292,829 5 Source: AT&T 2009 to 2014 10ks and Casewriter 18 TN Exhibit 1C AT&T Reorganized Balance Sheets 10 Operating Assets ($ millions): 11 Accounts Receivable 12 Prepaid Expenses 13 Deferred Taxes 14 Other Current Assets 15 Property, Plant & Equipment 16 Licenses 17 Goodwill & Other Intangibles 18 Customer Lists 19 Investments in Affiliates 00 Other Assets 01 Total Operating Assets 2009 14,845 1,562 1,247 3,792 99,519 48,741 78,276 7,393 2,921 6,275 264,571 2010 13,610 1,458 1,170 2,276 103,196 50,372 79,041 4,708 4,515 6,705 267,051 2011 13,231 1,102 1,470 4,137 107,087 51,374 76,054 2,757 3,718 6,467 267,397 2012 12,657 1,035 1,036 3,110 109,767 52,352 74,805 1,391 4,581 6,713 267,447 2013 12,918 960 1,199 4,780 110,968 56,433 75,052 2014 14,527 831 1,142 6,925 112,898 60,824 75,831 0 250 10,998 284,226 3,860 8,278 274,448 02 20,055 4,086 03 Operating Liabilities ($ millions): 04 Accounts Payable & Accrued Liabilities 05 Prepaid Revenue & Customer Deposits 06 Deferred Taxes 07 Post-Retirement Obligations 08 Deferred Taxes 21,260 4,170 1,681 27,847 23,579 19,956 3,872 1,003 34,011 25,748 20,911 3,808 1,026 41,392 28,491 21,107 4,212 1,774 29,946 36,308 23,592 4,105 1,091 37,079 37,544 28,803 22,070 Other Long-Term Liabilities Total Operating Liabilities 13,226 91,763 12,743 87,829 12,694 97,284 11,592 107,220 15,766 109,113 17,989 121,400 Net Operating Assets Change 172,808 NA 179,222 6,414 170,113 (9,109) 160,227 (9,886) 165,335 5,108 162,826 (2,509) AT&T Net Financial Obligations ($ millions): Dividends Payable Current Portion of Long-Term Debt Long-Term Debt Total Financial Obligations Less: Cash & Cash Equivalents Net Financial Obligations 2,479 7,361 64,720 74,560 3,741 70,819 2,542 7,196 58,971 68,709 1,437 67,272 2,608 3,453 61,300 67,361 3,045 64,316 2,556 3,486 66,358 72,400 4,868 67,532 2,404 5,498 69,290 77,192 3,339 73,853 2,438 6,056 76,011 84,505 8,603 75,902 Total Owners' Equity D/E Source: AT&T 2009 to 2014 10Ks and Casewriter 101,989 69.4% 111,950 60.1% 105,797 60.8% 92,695 72.9% 91,482 80.7% 86,924 87.3% TN Exhibit 1D AT&T Wireless Segment Data Wireless Operating Results ($ millions) (a): Service Revenue Equipment Revenue Total Operating Revenue Less: Operations & Support Expense -Less: Depreciation & Amortization Wireless Operating Income Plus: Net Income (Loss) in Affiliates Segment Income 2009 48,563 4,941 53,504 33,631 6,043 13,830 2010 53,510 4,990 58,500 36,746 6,497 15,257 2011 56,726 6,486 63,212 41,581 6,324 15,307 (29 15,278 2012 59,186 7,577 66,763 43,296 6,873 16,594 (62) 16,532 2013 61,552 8,347 69,899 44,508 7,468 17,923 2014 61,032 12,960 73,992 48,924 7,941 17,127 (112) 17,015 13,839 15,266 17,848 EBIT Margin EBITDA Margin - Equipment Revenue/Total Revenue Operations & Support/Total Operating Revenue 25.8% 37.1% 9.2% 62.9% 26.1% 37.2% 8.5% 62.8% 24.2% 34.2% 10.3% 65.8% 24.9% 35.1% 11.3% 64.9% 25.6% 36.3% 11.9% 63.7% 23.1% 33.9% 17.5% 66.1% Wireless Subscribers (000s): Postpaid Prepaid Resellers Connected Devices Total Wireless Subscribers 2009 64,627 5,350 10,439 4,704 85,120 2010 68,041 6,524 11,645 9,326 95,536 2011 69,309 7,225 13,644 13,069 103,247 2012 70,497 7,328 14,875 14,257 106,957 2013 72,638 7,384 14,028 16,326 110,376 2014 75,931 10,986 13,855 19,782 120,554 Net Wireless Additions (000s): Postpaid Prepaid Reseller Connected Devices Total Net Wireless Additions 4,199 (801) 1,803 2,077 7,278 2,153 952 1,140 4,608 8,853 1,429 674 1,874 3,722 7,699 1,438 128 1,027 1,171 3,764 1,776 (13) (1,074) 2,032 2,721 3,290 (775) (346) 3,439 5,608 Total Churn Rate Postpaid Churn Rate 1.47% 1.13% 1.31% 1.09% 1.37% 1.18% 1.35% 1.09% 1.37% 1.06% 1.45% 1.04% Average Total Customers (000s) Average Postpaid Customers (000s) ARPU Total Customers ($) N/A N/A N/A
Step by Step Solution
There are 3 Steps involved in it

Get step-by-step solutions from verified subject matter experts