

Question: Comprehensive Financial Statement Analysis - Using Exhibit 12.9 as a guide, compare C&C Sports performance to the industry averages. What particular observations and recommendations do
Comprehensive Financial Statement Analysis - Using Exhibit 12.9 as a guide, compare C&C Sports performance to the industry averages. What particular observations and recommendations do you have for George Douglas, president of C&C Sports?
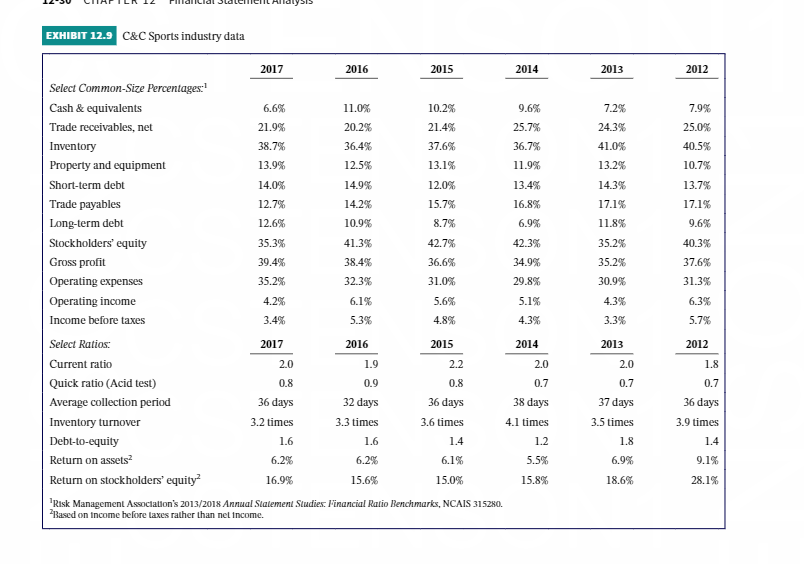
EXHIBIT 12.9 C&C Sports industry data 2013 2012 7.9% 25.0% 7.2% 24.3% 41.0% 13.2% 40.5% 10.7% 13.7% 14.3% 17.1% 11.8% 17.1% 9.6% 40.3% 35.2% 35.2% 30.9% 37.6% 31.3% 2017 2016 2015 2014 Select Common-Size Percentages: Cash & equivalents 6.6% 11.0% 10.2% 9.6% Trade receivables, net 21.9% 20.2% 21.4% 25.7% Inventory 38.7% 36.4% 37.6% 36.7% Property and equipment 13.9% 12.5% 13.1% 11.9% Short-term debt 14.0% 14.9% 12.0% 13.4% Trade payables 12.7% 14.2% 15.7% 16.8% Long-term debt 12.6% 10.9% 8.7% 6.9% Stockholders' equity 35.3% 41.3% 42.7% 42.3% Gross profit 39.4% 38.4% 36.6% 34.9% Operating expenses 35.2% 32.3% 31.0% 29.8% Operating income 4.2% 6.1% 5.6% 5.1% Income before taxes 3.4% 5.3% 4.8% 4.3% Select Ratios: 2017 2016 2015 2014 Current ratio 2.0 1.9 2.2 2.0 Quick ratio (Acid test) 0.8 0.8 0.7 Average collection period 36 days 32 days 36 days 38 days Inventory turnover 3.2 times 3.3 times 3.6 times 4.1 times Debt-to-equity 1.6 1.6 1.4 1.2 Return on assets 6.2% 6.2% 6.1% 5.5% Return on stockholders' equity? 16.9% 15.6% 15.0% 15.8% Risk Management Association's 2013/2018 Annual Statement Studies: Financial Ratio Benchmarks, NCAIS 315280. Based on income before laxes rather than net income. 4.3% 6.3% 3.3% 5.7% 2012 1.8 0.9 2013 2.0 0.7 37 days 3.5 times 1.8 6.9% 0.7 36 days 3.9 times 1.4 9.1% 28.1% 18.6%
Step by Step Solution
There are 3 Steps involved in it

Get step-by-step solutions from verified subject matter experts