

Question: Compressibility Factor Charts 1D altos 2. A chart for compressibility factor Z is presented in the Wolfram (Mathematica) demonstration at this link [1]. An example
![Z is presented in the Wolfram (Mathematica) demonstration at this link [1].](https://dsd5zvtm8ll6.cloudfront.net/si.experts.images/questions/2024/09/66f849f5ab177_89366f849f55e3e2.jpg)
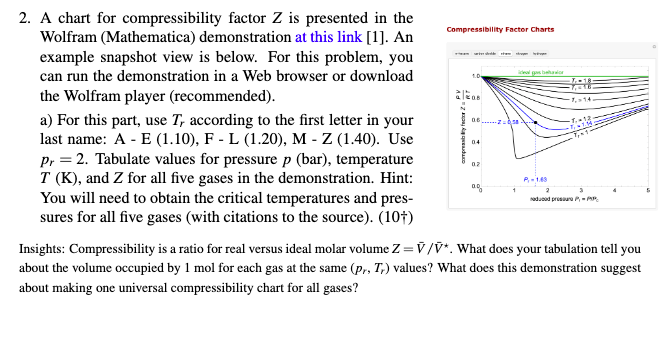
Compressibility Factor Charts 1D altos 2. A chart for compressibility factor Z is presented in the Wolfram (Mathematica) demonstration at this link [1]. An example snapshot view is below. For this problem, you can run the demonstration in a Web browser or download the Wolfram player (recommended). a) For this part, use T, according to the first letter in your last name: A - E (1.10), F - L (1.20), M-Z (1.40). Use Pr = 2. Tabulate values for pressure p (bar), temperature T (K), and Z for all five gases in the demonstration. Hint: You will need to obtain the critical temperatures and pres- sures for all five gases (with citations to the source). (101) Insights: Compressibility is a ratio for real versus ideal molar volume Z=7/*. What does your tabulation tell you about the volume occupied by 1 mol for each gas at the same (pr, T) values? What does this demonstration suggest about making one universal compressibility chart for all gases? Trycker 2 04 02 00 P-169 2 Nadwood procure- b) We have ethane in a 1 L tank at p. = 4. We empty the tank and discover that we have 25% more moles of ethane than we expected from calculations using the ideal gas law. What was the temperature in the tank? (10) Compressibility Factor Charts 1D altos 2. A chart for compressibility factor Z is presented in the Wolfram (Mathematica) demonstration at this link [1]. An example snapshot view is below. For this problem, you can run the demonstration in a Web browser or download the Wolfram player (recommended). a) For this part, use T, according to the first letter in your last name: A - E (1.10), F - L (1.20), M-Z (1.40). Use Pr = 2. Tabulate values for pressure p (bar), temperature T (K), and Z for all five gases in the demonstration. Hint: You will need to obtain the critical temperatures and pres- sures for all five gases (with citations to the source). (101) Insights: Compressibility is a ratio for real versus ideal molar volume Z=7/*. What does your tabulation tell you about the volume occupied by 1 mol for each gas at the same (pr, T) values? What does this demonstration suggest about making one universal compressibility chart for all gases? Trycker 2 04 02 00 P-169 2 Nadwood procure- b) We have ethane in a 1 L tank at p. = 4. We empty the tank and discover that we have 25% more moles of ethane than we expected from calculations using the ideal gas law. What was the temperature in the tank
Step by Step Solution
There are 3 Steps involved in it

Get step-by-step solutions from verified subject matter experts