

Question: Computation Part 1: 1. First Second Test Test 13 15 5 12 13 11 11 10 14 13 8 6 5. To measure the relationship
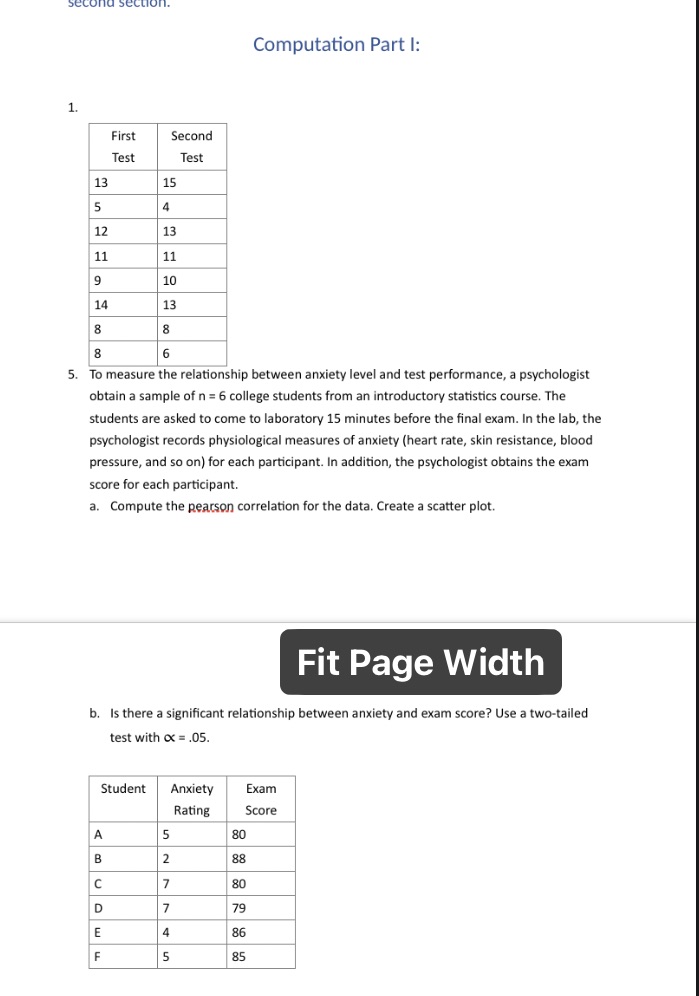
Computation Part 1: 1. First Second Test Test 13 15 5 12 13 11 11 10 14 13 8 6 5. To measure the relationship between anxiety level and test performance, a psychologist obtain a sample of n = 6 college students from an introductory statistics course. The students are asked to come to laboratory 15 minutes before the final exam. In the lab, the psychologist records physiological measures of anxiety (heart rate, skin resistance, blood pressure, and so on) for each participant. In addition, the psychologist obtains the exam score for each participant. a. Compute the pearson correlation for the data. Create a scatter plot. Fit Page Width b. Is there a significant relationship between anxiety and exam score? Use a two-tailed test with oc = .05. Student Anxiety Exam Rating Score A B 2 88 C 7 80 D 7 79 E 4 86 5 85
Step by Step Solution
There are 3 Steps involved in it

Get step-by-step solutions from verified subject matter experts