

Question: computational methods IE 1333 - Computational Methods Spring 2022 Homework 9 Due April 15 1. Open to read the attached file Homework9data.txt 2. The first
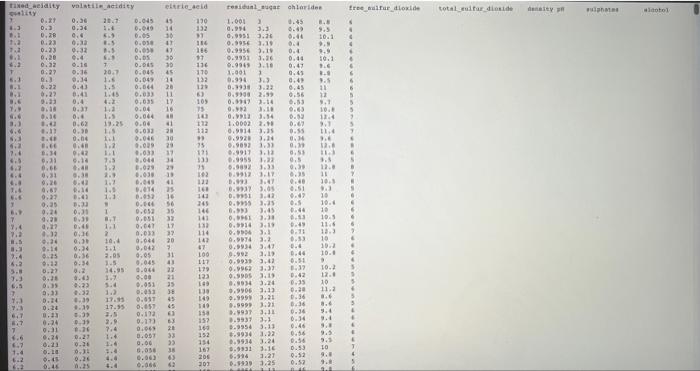
IE 1333 - Computational Methods Spring 2022 Homework 9 Due April 15 1. Open to read the attached file "Homework9data.txt" 2. The first row contains the column names. Read and store these in a list 3. The remaining 4898 columns contain observations different samples on each of those variables 4. Read all the attached data and store it into a variable as you see fit 5. Transform all the data into numeric values and convert it into a numpy array 6. Convert this array into a pandas dataframe (use the argument columns to assign the corresponding column names. Do not assign names to the indexes.) 7. Using matplotlib.pyplot, draw a plot with three subplots (call a 2x2 grid of subplots and leave the last one blank) where you insert dot plots of the first three data series against each other (81 vs2, si v s3, 52 v 53). Make sure to adequately label each axis and include a title to your figure. 8. Save the resulting figure into a png file (by right-clicking it in the plots window. It should technically be possible to do this with the plt.savefig() function if you want to try that too). Attach that figure with your submission. Pras valtii acidity citric acid free_war_cloxie total culture re wool 0.17 0.30 20.7 LE SPOO ST OLE 5+ CT to 0.00 EC PGD 1.1 . 0.28 0. 69 50" 30 91 > TE PE 0.016 CE CEO i RE 7.1 86 0.32 0.4 3.5 CO residen_wat chloride 1.001 3 9.5 0.99513.20 10.1 0.995 3.15 . 0.9956). 0. 2.9 0.9951 1.26 0.44 10.1 0.41 0.45 0.994 3.) 0.4 8.45 t' 0.05 186 17 30 7 0.20 0.32 0.27 03 SO T 0.16 20. 57 1 BLE 12 0.045 0.069 0.04 0.34 0.0 8.1 8167660 TOO BEE 467 066 1.6 1.5 to 6 0.22 9.33 P'T 11 6) 105 It It 41 5 . TEO SCOPO To 00 ch 10. C. 1.5 c'e 0.4 0.37 0.6 0.62 0.30 0.00 . 0.42 0.132.10 O. 3.1 0.113.14 1.0002 2.11 0.9314 3.35 0.9920 o 0.06 ELL .6 8. SET SI TT RETO 30 0.67 0.55 0.14 BE DE 2.1 11. 9. ES 8. 1.2 0.020 28 17 HO ED IT 171 7.4 6.5 3.13 I' 7.5 PE PIE 1606 CE 1660 ES5660 CE 416! 5 0.5 0.) 2 1.2 VE BE Te 0.61 0.31 0.26 0.67 1.029 0.038 10 0.04 D. 0.053 16 11 10.3 Et 9.00 6. 0.14 1.41 1.6 1.5 8.9914 0.93 5.0 SE 16 15 . 5 LEO EL 30 265 1660 10 0.35 0.24 re ICO 10 10.0 10 1 PPT SPE 0. 0.31 GE TE SOT ED LED 1.1 0.05 0.051 0.041 0.033 141 13 114 17 37 69 TO 11.6 . 7 . 7.2 3.5 3. 7.4 6.2 4.32 PO 0.9 0.3.1 0.14 3.11 0.3.3 0.974 0.9934 3.47 0.902 0.993 3.42 10.4 ETT . 0.31 0.14 00 ro' DE 4 10 10.2 10. 18 0. 0.46 0.05 SOE St 46 001 LIT PEO STO 169 0.27 0.00 LE 179 L'E 1960 t"01 7.3 0.63 1.7 21 0.990.09 Ert 12.0 10 0.35 CEO 10 TOO DO CET EB1 BET SE 36 CEO MOSE TE6690 TEE 666 Itt 0.20 7 Y. 0.14 0.017 GE ET 17.95 17.95 8.6 8.6 45 8.999 3.21 64 149 149 150 157 3.13 TETO PEO MEO TCO ST GE TE 6 16 6 16 0.13 0. 1.16 0.21 7 7.6 600 26 3.9954 3.13 . 0.24 TE 9 L 8.36 0.36 0.34 0.46 0.56 0.56 0.53 0.52 0.52 65+ 66 ST PE T 'T 't 9. TO CE NE TCO 1.4 01 0.038 0.06) 0.066 167 200 9.9931 3.16 3.27 9. 0.26 63 63 Pt 0.4 SEE cot IE 1333 - Computational Methods Spring 2022 Homework 9 Due April 15 1. Open to read the attached file "Homework9data.txt" 2. The first row contains the column names. Read and store these in a list 3. The remaining 4898 columns contain observations different samples on each of those variables 4. Read all the attached data and store it into a variable as you see fit 5. Transform all the data into numeric values and convert it into a numpy array 6. Convert this array into a pandas dataframe (use the argument columns to assign the corresponding column names. Do not assign names to the indexes.) 7. Using matplotlib.pyplot, draw a plot with three subplots (call a 2x2 grid of subplots and leave the last one blank) where you insert dot plots of the first three data series against each other (81 vs2, si v s3, 52 v 53). Make sure to adequately label each axis and include a title to your figure. 8. Save the resulting figure into a png file (by right-clicking it in the plots window. It should technically be possible to do this with the plt.savefig() function if you want to try that too). Attach that figure with your submission. Pras valtii acidity citric acid free_war_cloxie total culture re wool 0.17 0.30 20.7 LE SPOO ST OLE 5+ CT to 0.00 EC PGD 1.1 . 0.28 0. 69 50" 30 91 > TE PE 0.016 CE CEO i RE 7.1 86 0.32 0.4 3.5 CO residen_wat chloride 1.001 3 9.5 0.99513.20 10.1 0.995 3.15 . 0.9956). 0. 2.9 0.9951 1.26 0.44 10.1 0.41 0.45 0.994 3.) 0.4 8.45 t' 0.05 186 17 30 7 0.20 0.32 0.27 03 SO T 0.16 20. 57 1 BLE 12 0.045 0.069 0.04 0.34 0.0 8.1 8167660 TOO BEE 467 066 1.6 1.5 to 6 0.22 9.33 P'T 11 6) 105 It It 41 5 . TEO SCOPO To 00 ch 10. C. 1.5 c'e 0.4 0.37 0.6 0.62 0.30 0.00 . 0.42 0.132.10 O. 3.1 0.113.14 1.0002 2.11 0.9314 3.35 0.9920 o 0.06 ELL .6 8. SET SI TT RETO 30 0.67 0.55 0.14 BE DE 2.1 11. 9. ES 8. 1.2 0.020 28 17 HO ED IT 171 7.4 6.5 3.13 I' 7.5 PE PIE 1606 CE 1660 ES5660 CE 416! 5 0.5 0.) 2 1.2 VE BE Te 0.61 0.31 0.26 0.67 1.029 0.038 10 0.04 D. 0.053 16 11 10.3 Et 9.00 6. 0.14 1.41 1.6 1.5 8.9914 0.93 5.0 SE 16 15 . 5 LEO EL 30 265 1660 10 0.35 0.24 re ICO 10 10.0 10 1 PPT SPE 0. 0.31 GE TE SOT ED LED 1.1 0.05 0.051 0.041 0.033 141 13 114 17 37 69 TO 11.6 . 7 . 7.2 3.5 3. 7.4 6.2 4.32 PO 0.9 0.3.1 0.14 3.11 0.3.3 0.974 0.9934 3.47 0.902 0.993 3.42 10.4 ETT . 0.31 0.14 00 ro' DE 4 10 10.2 10. 18 0. 0.46 0.05 SOE St 46 001 LIT PEO STO 169 0.27 0.00 LE 179 L'E 1960 t"01 7.3 0.63 1.7 21 0.990.09 Ert 12.0 10 0.35 CEO 10 TOO DO CET EB1 BET SE 36 CEO MOSE TE6690 TEE 666 Itt 0.20 7 Y. 0.14 0.017 GE ET 17.95 17.95 8.6 8.6 45 8.999 3.21 64 149 149 150 157 3.13 TETO PEO MEO TCO ST GE TE 6 16 6 16 0.13 0. 1.16 0.21 7 7.6 600 26 3.9954 3.13 . 0.24 TE 9 L 8.36 0.36 0.34 0.46 0.56 0.56 0.53 0.52 0.52 65+ 66 ST PE T 'T 't 9. TO CE NE TCO 1.4 01 0.038 0.06) 0.066 167 200 9.9931 3.16 3.27 9. 0.26 63 63 Pt 0.4 SEE cot
Step by Step Solution
There are 3 Steps involved in it

Get step-by-step solutions from verified subject matter experts