

Question: **Compute 2011 only** P 7-10 Consecutive five-year balance sheets and income statements of Laura Gibson Corpo- ration are shown below and on the following page.
**Compute 2011 only**
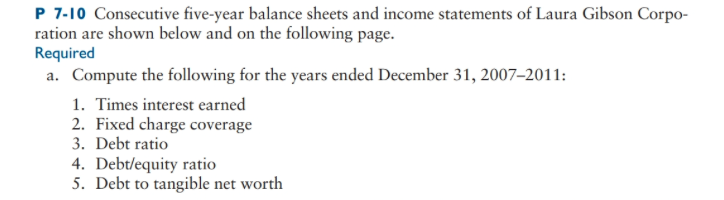
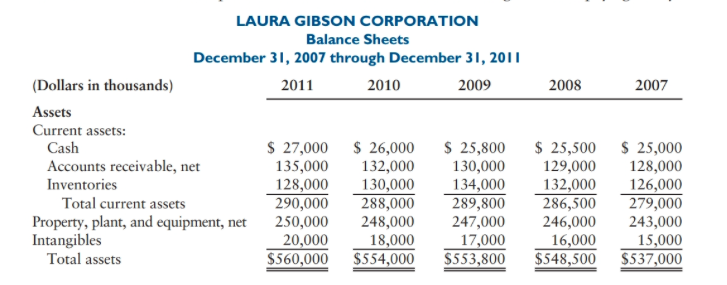
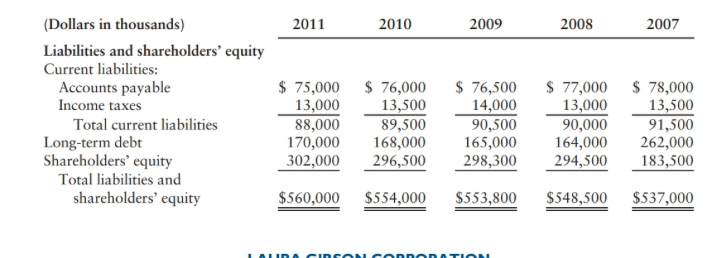
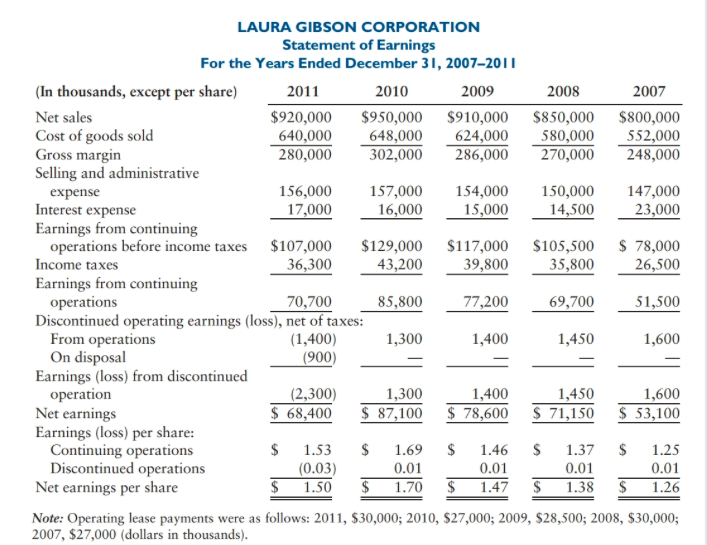
P 7-10 Consecutive five-year balance sheets and income statements of Laura Gibson Corpo- ration are shown below and on the following page. Required a. Compute the following for the years ended December 31, 2007-2011: 1. Times interest earned 2. Fixed charge coverage 3. Debt ratio 4. Debt/equity ratio 5. Debt to tangible net worth 2008 2007 LAURA GIBSON CORPORATION Balance Sheets December 31, 2007 through December 31, 2011 (Dollars in thousands) 2011 2010 2009 Assets Current assets: Cash $ 27,000 $ 26,000 $25,800 Accounts receivable, net 135,000 132,000 130,000 Inventories 128,000 130,000 134,000 Total current assets 290,000 288,000 289,800 Property, plant, and equipment, net 250,000 248,000 247,000 Intangibles 20,000 18,000 17,000 Total assets $560,000 $554,000 $553,800 $ 25,500 129,000 132,000 286,500 246,000 16,000 $548,500 $ 25,000 128,000 126,000 279,000 243,000 15,000 $537,000 2011 2010 2009 2008 2007 (Dollars in thousands) Liabilities and shareholders' equity Current liabilities: Accounts payable Income taxes Total current liabilities Long-term debt Shareholders' equity Total liabilities and shareholders' equity $ 75,000 13,000 88,000 170,000 302,000 $ 76,000 13,500 89,500 168,000 296,500 $ 76,500 14,000 90,500 165,000 298,300 $ 77,000 13,000 90,000 164,000 294,500 $ 78,000 13,500 91,500 262,000 183,500 $560,000 $554,000 $553,800 $548,500 $537,000 23,000 LAURA GIBSON CORPORATION Statement of Earnings For the Years Ended December 31, 2007-2011 (In thousands, except per share) 2011 2010 2009 2008 2007 Net sales $920,000 $950,000 $910,000 $850,000 $800,000 Cost of goods sold 640,000 648,000 624,000 580,000 552,000 Gross margin 280,000 302,000 286,000 270,000 248,000 Selling and administrative expense 156,000 157,000 154,000 150,000 147,000 Interest expense 17,000 16,000 15,000 14,500 Earnings from continuing operations before income taxes $107,000 $129,000 $117,000 $105,500 $ 78,000 Income taxes 36,300 43,200 39,800 35,800 26,500 Earnings from continuing operations 70,700 85,800 77,200 69,700 51,500 Discontinued operating earnings (loss), net of taxes: From operations (1,400) 1,300 1,400 1,450 1,600 On disposal (900) Earnings (loss) from discontinued operation (2,300) 1,300 1,400 1,450 1,600 Net earnings $ 68,400 $ 87,100 $ 78,600 $ 71,150 $ 53,100 Earnings (loss) per share: Continuing operations $ 1.53 $ 1.69 $ 1.46 $ 1.37 $ 1.25 Discontinued operations (0.03) 0.01 0.01 0.01 Net earnings per share $ 1.50 $ 1.70 $ 1.47 $ 1.38 $ 1.26 Note: Operating lease payments were as follows: 2011, $30,000; 2010, $27,000; 2009, $28,500; 2008, $30,000; 2007, $27,000 (dollars in thousands)
Step by Step Solution
There are 3 Steps involved in it

Get step-by-step solutions from verified subject matter experts