

Question: compute 2019 working capital turnover ratio, round to second decimal place balance sheet Xfx B D E 2017 2018 2019 Total net Revenues Cost of
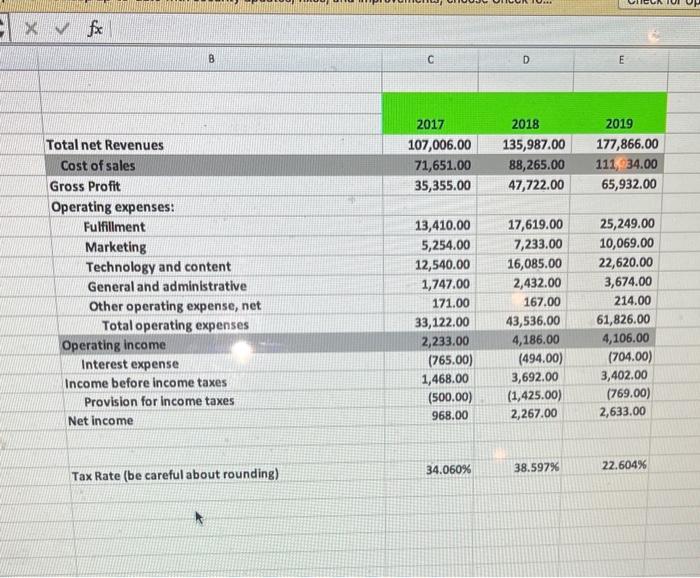
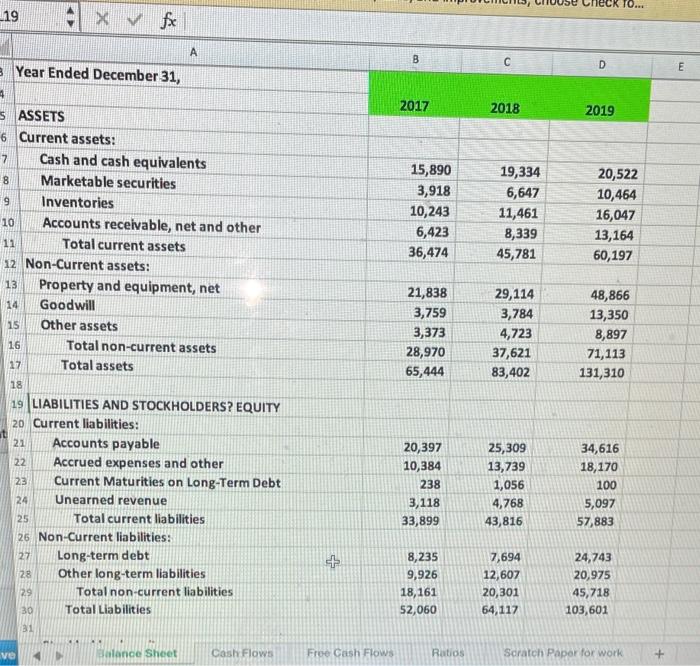
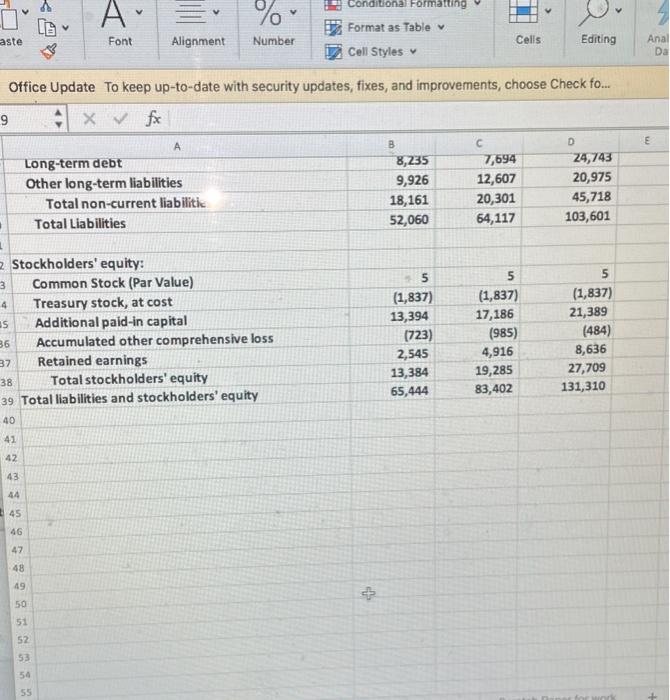
Xfx B D E 2017 2018 2019 Total net Revenues Cost of sales 107,006.00 71,651.00 35,355.00 135,987.00 B8,265.00 47,722.00 177,866.00 111, 34.00 65,932.00 Gross Profit 17,619.00 7,233.00 16,085.00 2,432.00 Operating expenses: Fulfillment Marketing Technology and content General and administrative Other operating expense, net Total operating expenses Operating income Interest expense Income before income taxes Provision for income taxes 167.00 13,410.00 5,254.00 12,540.00 1,747.00 171.00 33,122.00 2,233.00 (765.00) 1,468.00 (500.00) 43,536.00 4,186.00 (494.00) 3,692.00 (1,425.00) 2,267.00 25,249.00 10,069.00 22,620.00 3,674.00 214.00 61,826.00 4,106.00 (704.00) 3,402.00 (769.00) 2,633.00 968.00 Net income 34.060% 38.597% 22.604% Tax Rate (be careful about rounding) file. Go to the financial statements and compute the 2019 Working Capital Turnover Ratio. Round your answer to the second decimal place. 0... _19 A B C D 3 Year Ended December 31, E 4 2017 2018 2019 S ASSETS 6 Current assets: Cash and cash equivalents 8 Marketable securities 7 15,890 3,918 9 Inventories 10 Accounts receivable, net and other 11 Total current assets 12 Non-Current assets: 13 Property and equipment, net Goodwill 10,243 6,423 36,474 19,334 6,647 11,461 8,339 45,781 20,522 10,464 16,047 13,164 60,197 14 15 21,838 3,759 3,373 28,970 65,444 48,866 13,350 8,897 29,114 3,784 4,723 37,621 83,402 Other assets Total non-current assets Total assets 16 71,113 17 131,310 18 25,309 19 LIABILITIES AND STOCKHOLDERS? EQUITY 20 Current liabilities: 21 Accounts payable Accrued expenses and other 23 Current Maturities on Long-Term Debt Unearned revenue Total current liabilities 22 20,397 10,384 238 13,739 1,056 34,616 18,170 100 24 3,118 33,899 4,768 43,816 5,097 57,883 25 26 Non-Current liabilities: 27 Long-term debt 28 Other long-term liabilities 29 Total non-current liabilities + 8,235 9,926 18,161 52,060 7,694 12,607 20,301 64,117 24,743 20,975 45,718 103,601 30 Total Liabilities 31 ve Balance Sheet Cash Flows Free Cash Flows Ratios Scratch Paper for work Conditional Formatting aste Font Alignment Number Format as Table Cell Styles Cells Editing Anal Da Office Update To keep up-to-date with security updates, fixes, and improvements, choose Check fo... 9 A Long-term debt Other long-term liabilities Total non-current liabilitic B 8,235 9,926 18,161 52,060 7,694 12,607 20,301 D 24,743 20,975 45,718 Total Liabilities 64,117 103,601 1 5 5 5 2 Stockholders' equity: 3 Common Stock (Par Value) 4 Treasury stock, at cost 15 Additional paid-in capital 36 Accumulated other comprehensive loss Retained earnings 38 Total stockholders' equity 39 Total liabilities and stockholders' equity (1,837) 13,394 (723) 2,545 (1,837) 17,186 (985) 4,916 19,285 83,402 (1,837) 21,389 (484) 8,636 27,709 131,310 37 13,384 65,444 40 41 42 43 45 46 47 48 49 + 50 51 52 53 54 55
Step by Step Solution
There are 3 Steps involved in it

Get step-by-step solutions from verified subject matter experts