

Question: - Compute a three-period moving average for sales for weeks 5, 6, and 7. - Compute a four-period moving average for sales for weeks 5,
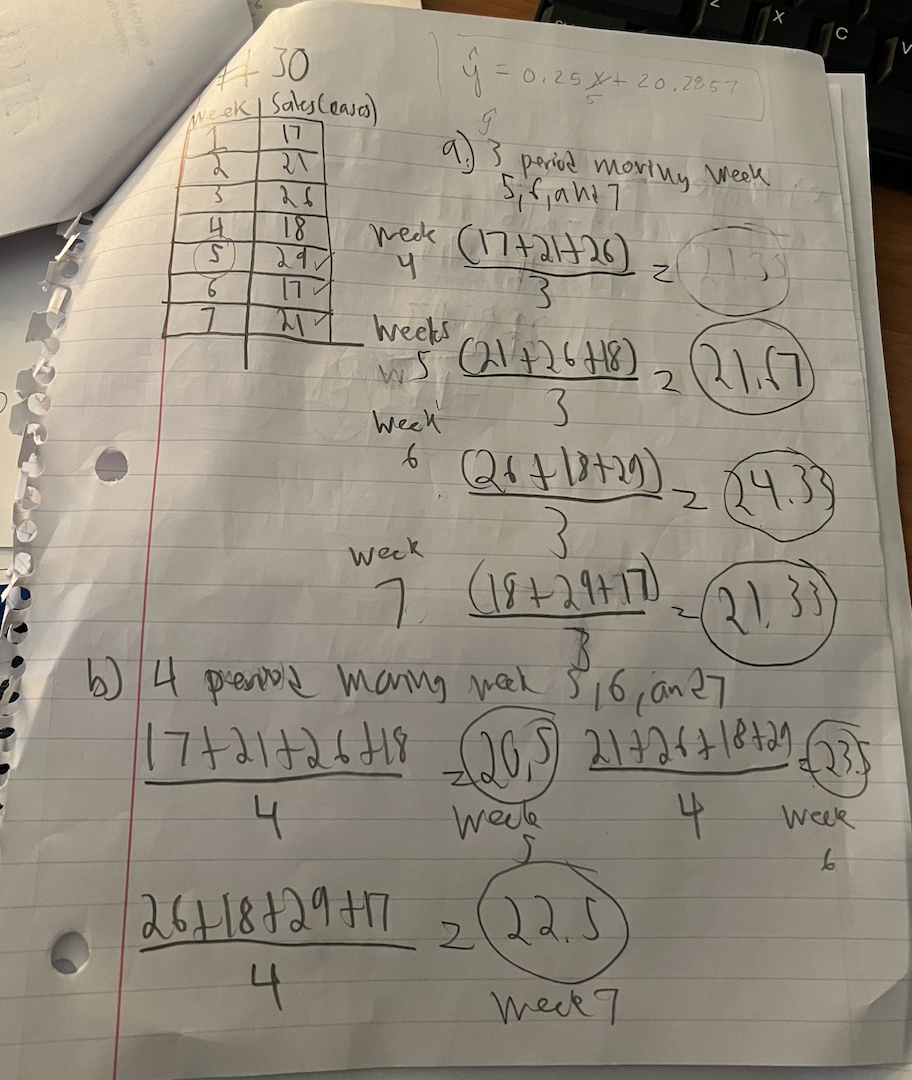
- Compute a three-period moving average for sales for weeks 5, 6, and 7.
- Compute a four-period moving average for sales for weeks 5, 6 and 7.
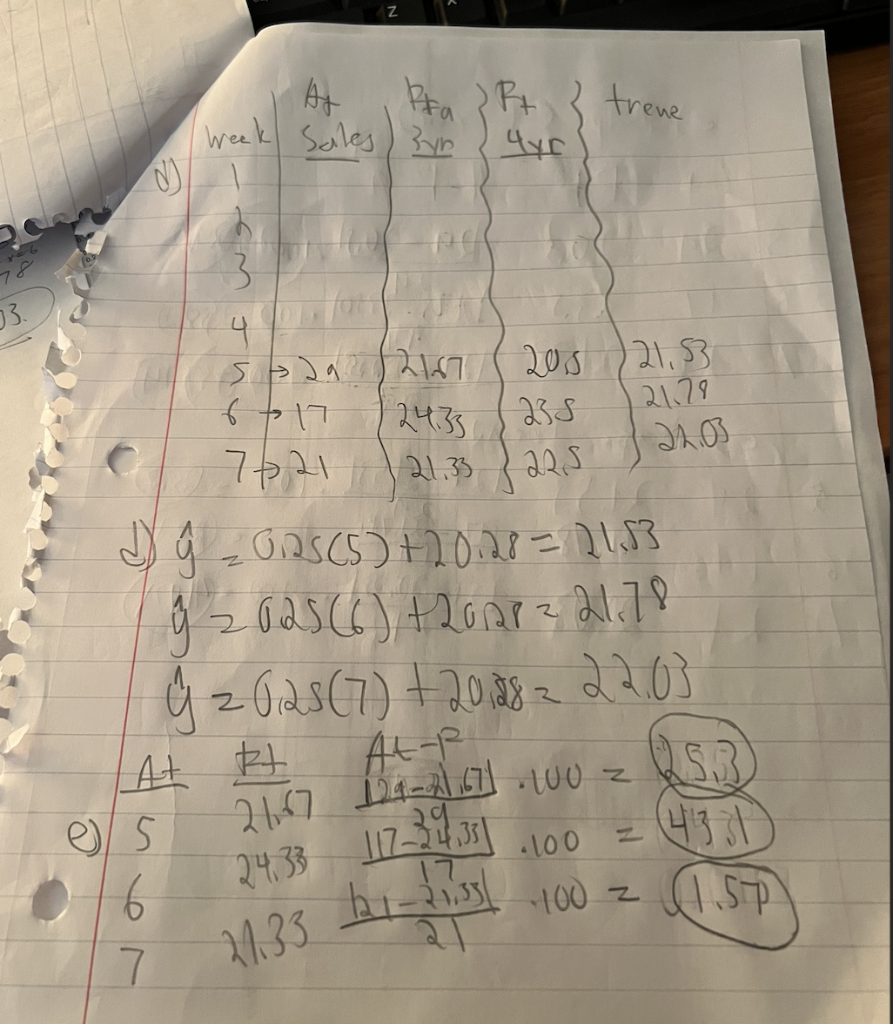
- Create a trend line for the data. The excel printout MUST accompany your hand in assignment.
- Use the trend line to determine the demand for weeks 5, 6 and 7.
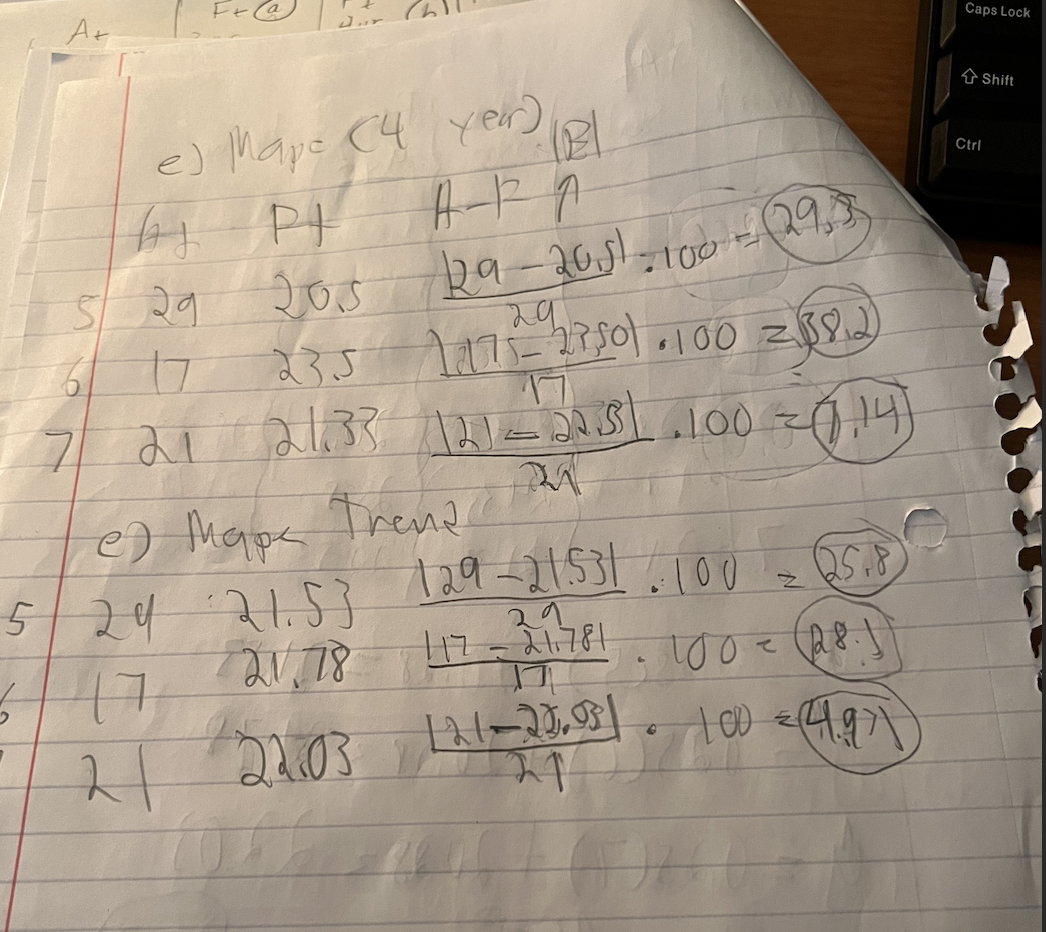
- Find the MAPE for all three forecasting methods. Which of the three forecasting methods provided the best forecast?
- Use the best forecasting method to determine sales in week 8.
Some of the work has been done but I cannot figure out the last one
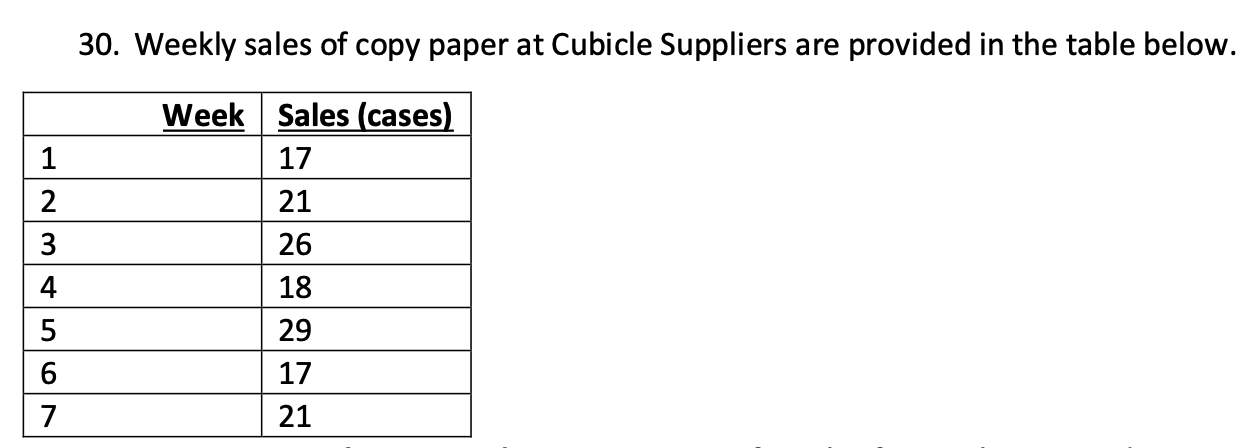
30. Weekly sales of copy paper at Cubicle Suppliers are provided in the table below 30 b) 4 persored maring wal 516 , and 7 417+21+26+18=2(20,5)421+26+18+21=(235) weec 426+18+29+17=meck722.5 (c) d) y^y^y^=0.25(5)+20.28=21.53=0.25(6)+20,28=21.78=0.25(7)+20.28=22.03 72121,33212122.31100=(0.14)
Step by Step Solution
There are 3 Steps involved in it

Get step-by-step solutions from verified subject matter experts