

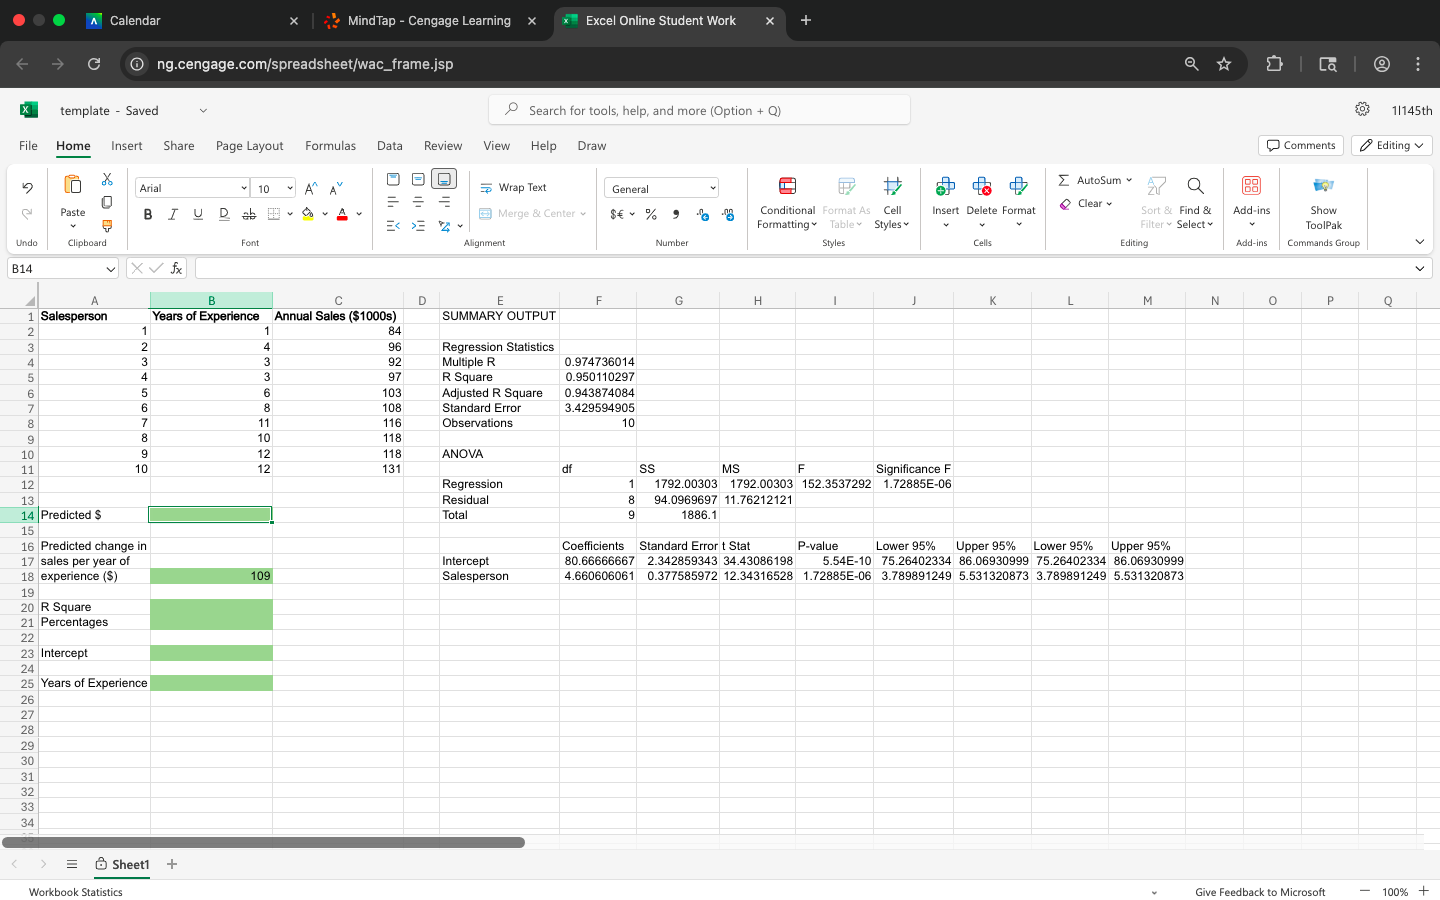
Question: Compute b 1 and b 0 (to 1 decimal). b 1 = fill in the blank 2 b 0 = fill in the blank 3
Compute b 1 and b 0 (to 1 decimal). b 1 = fill in the blank 2 b 0 = fill in the blank 3 Complete the estimated regression equation (to 1 decimal). = fill in the blank 4 + fill in the blank 5 x According to this model, what is the change in annual sales ($1000s) for every year of experience (to 1 decimal)? fill in the blank 6 Compute the coefficient of determination (to 3 decimals). Note: report r 2 between 0 and 1. r 2 = fill in the blank 7 What percentage of the variation in annual sales ($1000s) can be explained by the years of experience of the salesperson (to 1 decimal)? fill in the blank 8 %
 O A Calendar X MindTap - Cengage Learning X * Excel Online Student Work C ng.cengage.com/spreadsheet/wac_frame.jsp Ca X template - Saved Search for tools, help, and more (Option + Q) 1/145th File Home Insert Share Page Layout Formulas Data Review View Help Draw Comments Editing * 10 " A" Wrap Text AutoSum Arial General Q 88 Paste Merge
 Step by Step Solution
There are 3 Steps involved in it
1 Expert Approved Answer
Step: 1 Unlock

Question Has Been Solved by an Expert!
Get step-by-step solutions from verified subject matter experts
Step: 2 Unlock
Step: 3 Unlock