

Question: Compute, compare, and interpret the operating, financial, and combined leverage of Disney and its media peers. Thanks! DIS Equity Disney FY2018 FY2017 59,434 55,137 14,837
Compute, compare, and interpret the operating, financial, and combined leverage of Disney and its media peers. Thanks!
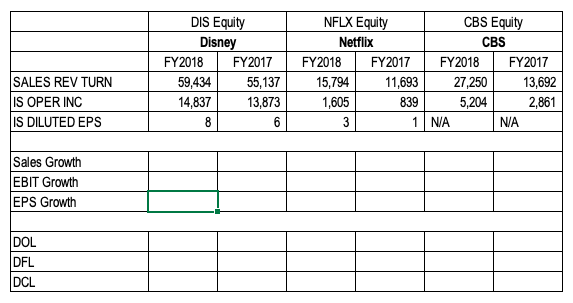
DIS Equity Disney FY2018 FY2017 59,434 55,137 14,837 13,873 8 6 NFLX Equity CBS Equity Netflix CBS FY2018 FY2017 FY2018 FY2017 15,794 11,693 27,250 13,692 1,605 839 5,204 2,861 3 1 N/A NA SALES REV TURN IS OPER INC IS DILUTED EPS Sales Growth EBIT Growth EPS Growth DOL DFL DCL DIS Equity Disney FY2018 FY2017 59,434 55,137 14,837 13,873 8 6 NFLX Equity CBS Equity Netflix CBS FY2018 FY2017 FY2018 FY2017 15,794 11,693 27,250 13,692 1,605 839 5,204 2,861 3 1 N/A NA SALES REV TURN IS OPER INC IS DILUTED EPS Sales Growth EBIT Growth EPS Growth DOL DFL DCL
Step by Step Solution
There are 3 Steps involved in it

Get step-by-step solutions from verified subject matter experts