

Question: The graph between two temperature scales A and B is shown in figure. Between upper fixed point and lower fixed point there are 150
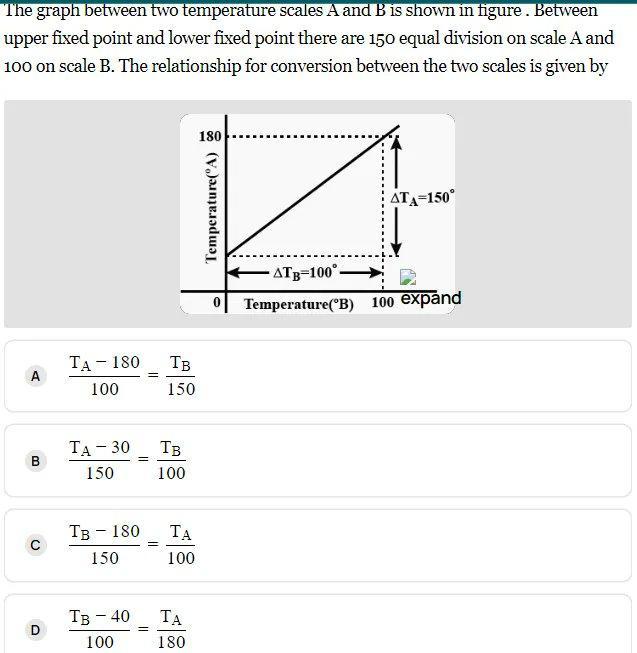
The graph between two temperature scales A and B is shown in figure. Between upper fixed point and lower fixed point there are 150 equal division on scale A and 100 on scale B. The relationship for conversion between the two scales is given by A B D TA 180 100 TA - 30 150 = TB - 40 100 150 TB180 150 100 = 100 180 180 Temperature (A) =150 ATB-100- Temperature (B) 100 expand
Step by Step Solution
★★★★★
3.55 Rating (155 Votes )
There are 3 Steps involved in it
1 Expert Approved Answer
Step: 1 Unlock

for Scale A for Scale B Lowest point Upper ... View full answer
Question Has Been Solved by an Expert!
Get step-by-step solutions from verified subject matter experts
Step: 2 Unlock
Step: 3 Unlock