

Question: Compute, Disaggregate, and Interpret ROE and ROA Selected balance sheet and income statement information from The ODP Corporation (the Company) follows ($ millions). Sales Interest
Compute, Disaggregate, and Interpret ROE and ROA Selected balance sheet and income statement information from The ODP Corporation (the Company) follows ($ millions). Sales Interest Expense Net Loss Total Assets Stockholders Equity 2020 2020 2020 2020 2019 2020 2019 $9,710 $42 $(319) $5,558 $7,311 $1,880 $2,173
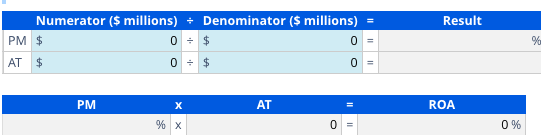
a. Compute the 2020 return on equity (ROE), return on assets (ROA), and return on nancial leverage (ROFL). Use 25% as the statutory tax rate. Note: Enter your answers rounded to one digit after the decimal. Use a negative sign when necessary. Numerator ($ millions) Denominator ($ millions) = Result ROE Answer 0 Answer 0 = ROA Answer 0 Answer 0 = Note: Enter the percent rounded to two digits after the decimal. Use a negative sign when
b. Disaggregate ROA into prot margin (PM) and asset turnover (AT). Note: Enter your answers rounded to one digit after the decimal. Use a negative sign when necessary.
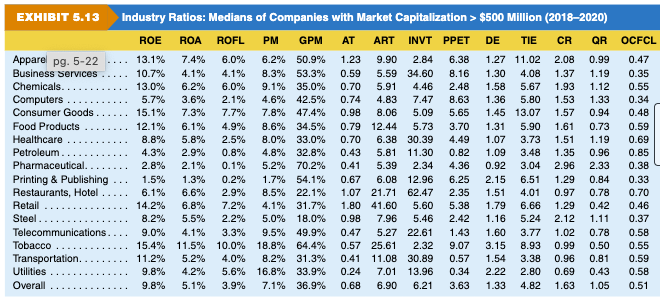
c. What inferences do we draw from PM compared to AT? How do these ratios compare to retail industry medians (refer to Exhibit 5.13)?
 The Company has a AnswerPositiveNegative
profit margin. Compared to the median profit margin of the retail industry of Answer
%, the Company's profit margin is AnswerHigherLower. Compared to the median asset turnover of the retail industry of Answer
, the Company's asset turnover is AnswerHigherLower. Compared to the median return on equity of the retail industry of Answer
%, the Company's return on equity is AnswerHigherLower
. Compared to the median return on assets of the retail industry of Answer
%, the Company's return on assets is AnswerHigherLower
. Compared to the retail industry, The ODP Corporation is doing AnswerWellPoorly
.
Step by Step Solution
There are 3 Steps involved in it

Get step-by-step solutions from verified subject matter experts