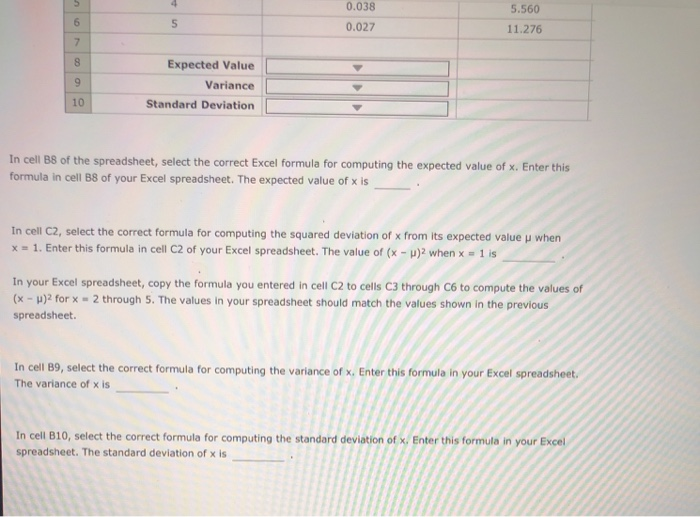
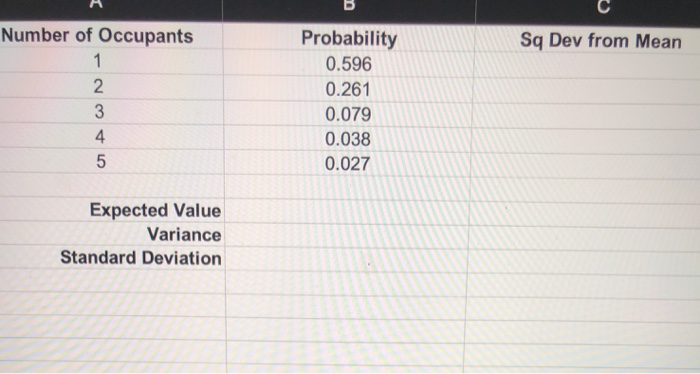
Question: compute expected value, variance and standard deviation of a discrete random variable. 3. Using Excel - Computing the expected value, variance and standard deviation of

compute expected value, variance and standard deviation of a discrete random variable. compute expected value, variance and standard
compute expected value, variance and standard
3. Using Excel - Computing the expected value, variance and standard deviation of a discrete random variable Aa Aa E Data on the number of occupants was collected for a large sample of renter-occupied, rent-controlled housing units as part of the New York City Housing and Vacancy Survey. The relative frequency method is used to develop the following probability distribution for the number of occupants in a renter-occupied, rent-controlled housing unit in New York City: Number of Occupants Probability f(x) 1 0.596 2 0.261 3 0.079 4 0.038 0.027 5 To answer the questions that follow, download an Excel spreadsheet containing the previous data by clicking the following words in bold: Download Excel file. The upper left-hand corner of the Excel spreadsheet in the file you download should look like the following sample spreadsheet (except for the numeric values in column C): B 1 Number of Occupants 1 Sq Dev from Mean 2 Probability 0.596 0.261 3 2 0.128 1.844 4 3 0.079 5 4 0.038 0.027 5.560 11.276 6 5 7 00 9 Expected Value Variance Standard Deviation 10 5 4 0.038 6 5 5.560 11.276 0.027 7 8 Expected Value Variance 9 10 Standard Deviation In cell B8 of the spreadsheet, select the correct Excel formula for computing the expected value of x. Enter this formula in cell B8 of your Excel spreadsheet. The expected value of x is In cell C2, select the correct formula for computing the squared deviation of x from its expected value when x = 1. Enter this formula in cell C2 of your Excel spreadsheet. The value of (x - )2 when x = 1 is In your Excel spreadsheet, copy the formula you entered in cell C2 to cells C3 through C6 to compute the values of (x - )2 for x = 2 through 5. The values in your spreadsheet should match the values shown in the previous spreadsheet In cell B9, select the correct formula for computing the variance of X. Enter this formula in your Excel spreadsheet The variance of x is In cell B10, select the correct formula for computing the standard deviation of x. Enter this formula in your Excel spreadsheet. The standard deviation of x is Sq Dev from Mean Number of Occupants 1 2. 3 4 5 Probability 0.596 0.261 0.079 0.038 0.027 Expected Value Variance Standard Deviation

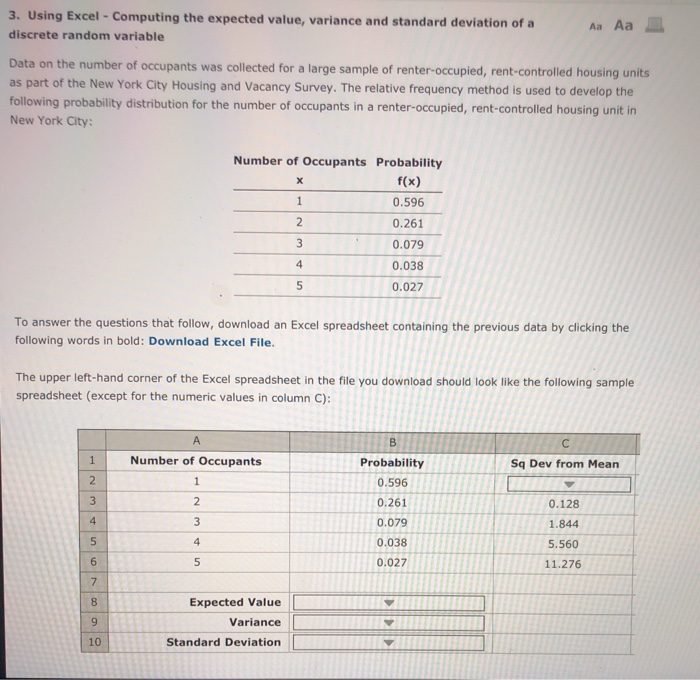
Step by Step Solution

There are 3 Steps involved in it

1 Expert Approved Answer
Step: 1 Unlock blur-text-image
Question Has Been Solved by an Expert!

Get step-by-step solutions from verified subject matter experts

Step: 2 Unlock
Step: 3 Unlock

Students Have Also Explored These Related General Management Questions!