

Question: Compute for RETURN ON CAPITAL, RETURN ON EQUITY, RETURN ON ASSETS, ASSET TURNOVER RATIO, RECEIVABLE TURNOVER RATIO, PROFIT MARGIN RATIO, LONG TERM DEBT RATIO, LONG
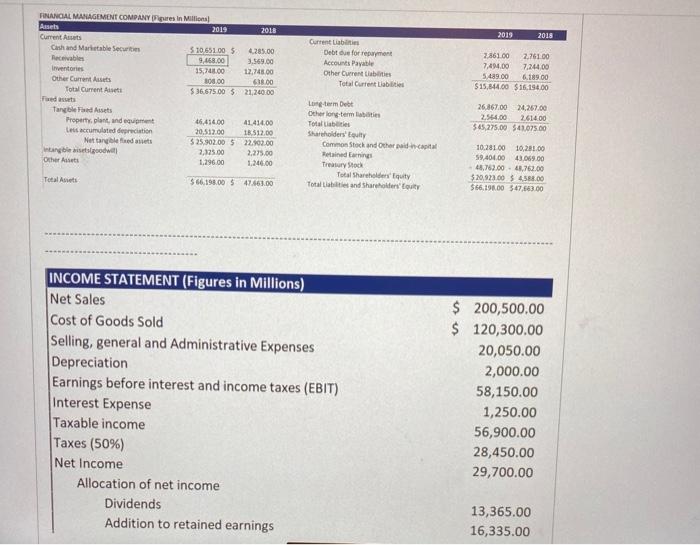
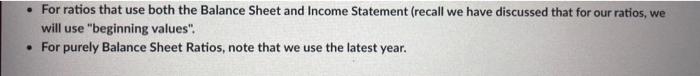
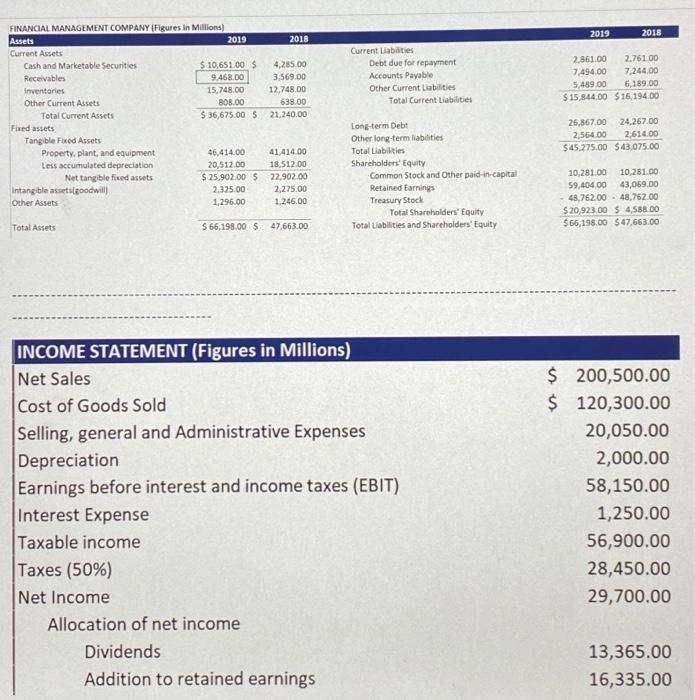
2019 2018 FRANCIAL MANAGEMENT COMPANY Pares in Millions Assets 2019 2018 Current Cash and Marketable Securit 510651005 4.285.00 Receivables 9.468.00 3.569.00 Inventories 15,741.00 12,748.00 Other Current Assets 300.00 638.00 Total Current $36,675.00 5 21,240.00 Current Liabiti Debt for repayment Accounts Payable Other Current Labetes Total Current Liabilities 2.861.00 2.76100 7,499.00 7.244.00 5489.00 6.189.00 $15,144.00 $16.190.00 26.367.00 24.267.00 2.544.00 2.614.00 $45,275.00 $41.075.00 Tangle Fred Assets Property, plant, and equipment Les accumulated depreciation Nettable Inang beses Other Asset 46,414.00 41.414.00 20,512.00 18 512.00 525.902.00 5 22.902.00 2,125.00 2,275.00 1.296.00 1,246.00 Long-term Debt Other long-term lates Totalbes Sartholders' Equity Common Stock and Other paid capital Meine Earning Treasury Stock Total Shareholders Equity Total abilities and Shareholders 1028100 10,281.00 59.404.00 43.069.00 43,762.00 -4.762.00 $29,923.00 $ 4588.00 $66.198.00 $ 47,663.00 Total Aves $66.198.00 $ 47.561.00 INCOME STATEMENT (Figures in Millions) Net Sales Cost of Goods Sold Selling, general and Administrative Expenses Depreciation Earnings before interest and income taxes (EBIT) Interest Expense Taxable income Taxes (50%) Net Income Allocation of net income Dividends Addition to retained earnings $ 200,500.00 $ 120,300.00 20,050.00 2,000.00 58,150.00 1,250.00 56,900.00 28,450.00 29,700.00 13,365.00 16,335.00 . For ratios that use both the Balance Sheet and Income Statement (recall we have discussed that for our ratios, we will use "beginning values". For purely Balance Sheet Ratios, note that we use the latest year. 2018 2019 2018 Current Liabities Debt due for repayment Accounts Payable Other Current Liabilities Total Current Liabilities 4.265.00 3,569.00 12,748.00 638.00 21,240.00 FINANCIAL MANAGEMENT COMPANY (Figures in Millions) Assets 2019 Current Assets Cash and Marketable Securities $ 10,651.00 $ Receivables 9,468.00 Inventaries 15,748.00 Other Current Assets 800.00 Total Current Assets $36,675.00 Faxed assets Tangible Fixed Assets Property, plant, and equipment 46,414.00 Less accumulated depreciation 20,512.00 Net tangible fixed assets $ 25,902.00 $ Intangible assetsgoodwill 2.325.00 Other Assets 1,296.00 2.861.00 2.761 00 7.494.00 7.244.00 5.489.00 6,189.00 $15.844.00 $16,194.00 26,867.00 24,267.00 2,56400 2.614.00 $45.275.00 $ 43,075,00 41414.00 18,512.00 22,902.00 2,275.00 1,246.00 Long-term Debt Other long-term liabilities Total Liabilities Shareholders' Equity Common Stock and Other paid-in-capital Retained Earnings Treasury Stock Total Shareholders' Equity Total Liabilities and Shareholders' Equity 10,281.00 10.281.00 59.404.00 43,069.00 -48,762.00 - 48.762.00 $20,923.00 $ 4,588.00 $ 66,198.00 $ 47,663.00 Total Assets 566,198.00 $ 47.663.00 INCOME STATEMENT (Figures in Millions) Net Sales Cost of Goods Sold Selling, general and Administrative Expenses Depreciation Earnings before interest and income taxes (EBIT) Interest Expense Taxable income Taxes (50%) Net Income Allocation of net income Dividends Addition to retained earnings $ 200,500.00 $ 120,300.00 20,050.00 2,000.00 58,150.00 1,250.00 56,900.00 28,450.00 29,700.00 13,365.00 16,335.00
Step by Step Solution
There are 3 Steps involved in it

Get step-by-step solutions from verified subject matter experts