

Question: compute MAPE for each data set. which forecast appears to be more accurate? (round your intermeditate calculations and final answrs to 2 decimal place )
compute MAPE for each data set. which forecast appears to be more accurate? (round your intermeditate calculations and final answrs to 2 decimal place ) 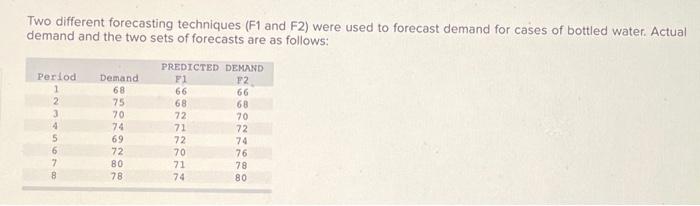
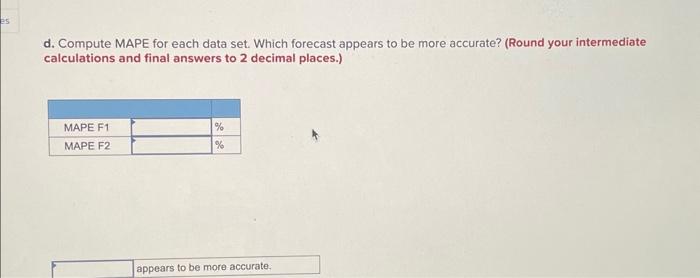
Two different forecasting techniques (F1 and F2) were used to forecast demand for cases of bottled water. Actual demand and the two sets of forecasts are as follows: d. Compute MAPE for each data set. Which forecast appears to be more accurate? (Round your intermediate calculations and final answers to 2 decimal places.)
Step by Step Solution
There are 3 Steps involved in it
1 Expert Approved Answer
Step: 1 Unlock

Question Has Been Solved by an Expert!
Get step-by-step solutions from verified subject matter experts
Step: 2 Unlock
Step: 3 Unlock