

Question: Compute r for the following data and test the hypothesis H0: r 0. Draw the scatter plot; then explain the results. X -3 -2 -1
Compute r for the following data and test the hypothesis H0: r 0. Draw the scatter plot; then explain the results.
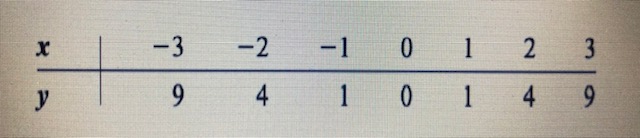
X -3 -2 -1 0 2 | W 4 1 4
Step by Step Solution
There are 3 Steps involved in it
1 Expert Approved Answer
Step: 1 Unlock

Question Has Been Solved by an Expert!
Get step-by-step solutions from verified subject matter experts
Step: 2 Unlock
Step: 3 Unlock