

Question: . Compute Real GDP growth rates in 5-year increments using data from Table 3.6. I have attached a sample from 1960 to 1965 showing
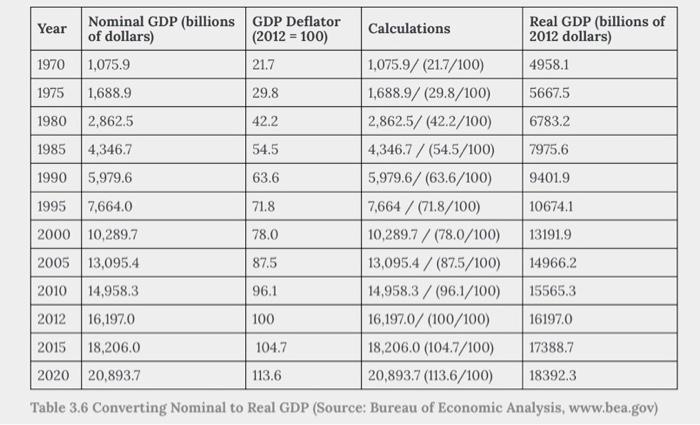
. Compute Real GDP growth rates in 5-year increments using data from Table 3.6. I have attached a sample from 1960 to 1965 showing the correct answer and how to set it up. From 1965 to 1970 the correct growth rate in Real GDP is 18.4%. You need to calculate the rest of the years beginning with 1970 to 1975 and going all the way up to 2010. Nominal GDP (billions GDP Deflator of dollars) (2012 = 100) 1970 1,075.9 21.7 1975 1,688.9 29.8 1980 2,862.5 42.2 1985 4,346.7 54.5 1990 5,979.6 63.6 1995 7,664.0 71.8 2000 10,289.7 78.0 2005 13,095.4 87.5 2010 14,958.3 96.1 14,958.3/ (96.1/100) 2012 16,197.0 100 16,197.0/(100/100) 2015 18,206.0 104.7 18,206.0 (104.7/100) 2020 20,893.7 113.6 20,893.7 (113.6/100) Table 3.6 Converting Nominal to Real GDP (Source: Bureau of Economic Analysis, www.bea.gov) Year Calculations 1,075.9/ (21.7/100) 1,688.9/ (29.8/100) Real GDP (billions of 2012 dollars) 4958.1 5667.5 6783.2 7975.6 9401.9 10674.1 13191.9 14966.2 15565.3 16197.0 17388.7 18392.3 2,862.5/(42.2/100) 4,346.7 / (54.5/100) 5,979.6/ (63.6/100) 7,664 / (71.8/100) 10,289.7/(78.0/100) 13,095.4/(87.5/100)
Step by Step Solution
3.48 Rating (164 Votes )
There are 3 Steps involved in it
ANSWER The value of economic output adjusted for changes in price is whats known as real gross domestic product or real GDP This is a macroeconomic metric ie inflation or deflation 1 Because of this a... View full answer

Get step-by-step solutions from verified subject matter experts