

Question: Compute the 2020 return on assets and the return on common stockholders' equity ratios for both companies. Question 1 of 3 -/1 View Policies Current
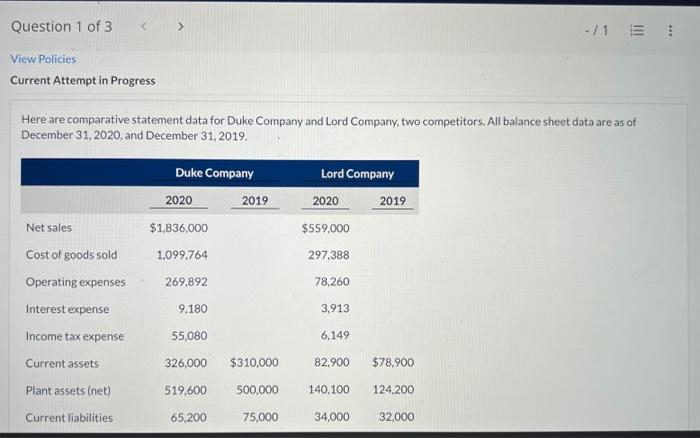
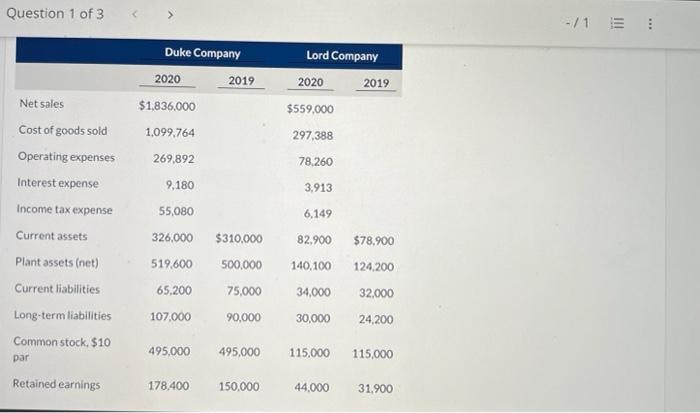
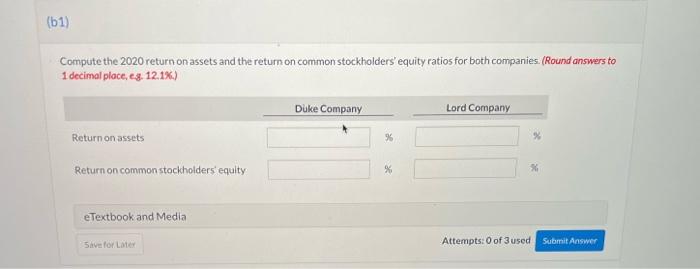
Question 1 of 3 -/1 View Policies Current Attempt in Progress Here are comparative statement data for Duke Company and Lord Company, two competitors. All balance sheet data are as of December 31, 2020, and December 31, 2019. Duke Company 2020 2019 $1,836,000 Lord Company 2020 2019 $559,000 Net sales 1,099.764 297.388 269,892 78,260 9.180 3,913 Cost of goods sold Operating expenses Interest expense Income tax expense Current assets Plant assets (net) Current liabilities 55,080 6,149 326.000 $310,000 82.900 $78.900 519,600 500,000 140,100 124,200 65.200 75,000 34,000 32,000 Question 1 of 3 > -/1 Duke Company 2020 2019 Lord Company 2020 2019 $559.000 $1,836,000 1.099,764 297,388 Net sales Cost of goods sold Operating expenses Interest expense Income tax expense 269.892 78.260 9.180 3.913 55,080 6,149 Current assets 326,000 82,900 $78.900 519,600 140,100 124.200 $310,000 500,000 75,000 90,000 65,200 Plant assets (net) Current liabilities Long-term liabilities Common stock, $10 par 32.000 34,000 30,000 107.000 24,200 495.000 495.000 115,000 115,000 Retained earnings 178,400 150,000 44.000 31.900 (61) Compute the 2020 return on assets and the return on common stockholders' equity ratios for both companies. (Round answers to 1 decimal place, c.8. 12.1%) Duke Company Lord Company Return on assets 95 % Return on common stockholders equity % X eTextbook and Media Save for late Attempts: 0 of 3 used Submit
Step by Step Solution
There are 3 Steps involved in it

Get step-by-step solutions from verified subject matter experts