

Question: Compute the 99% confidence interval for the dependent variable, for a selected value of the independent variable. Each student can choose a value to use
Compute the 99% confidence interval for the dependent variable, for a selected value of the independent variable. Each student can choose a value to use for the independent variable (use same value in the next step). Interpret this interval.
Using the same chosen value for part (8), estimate the 99% prediction interval for the dependent variable. Interpret this interval.
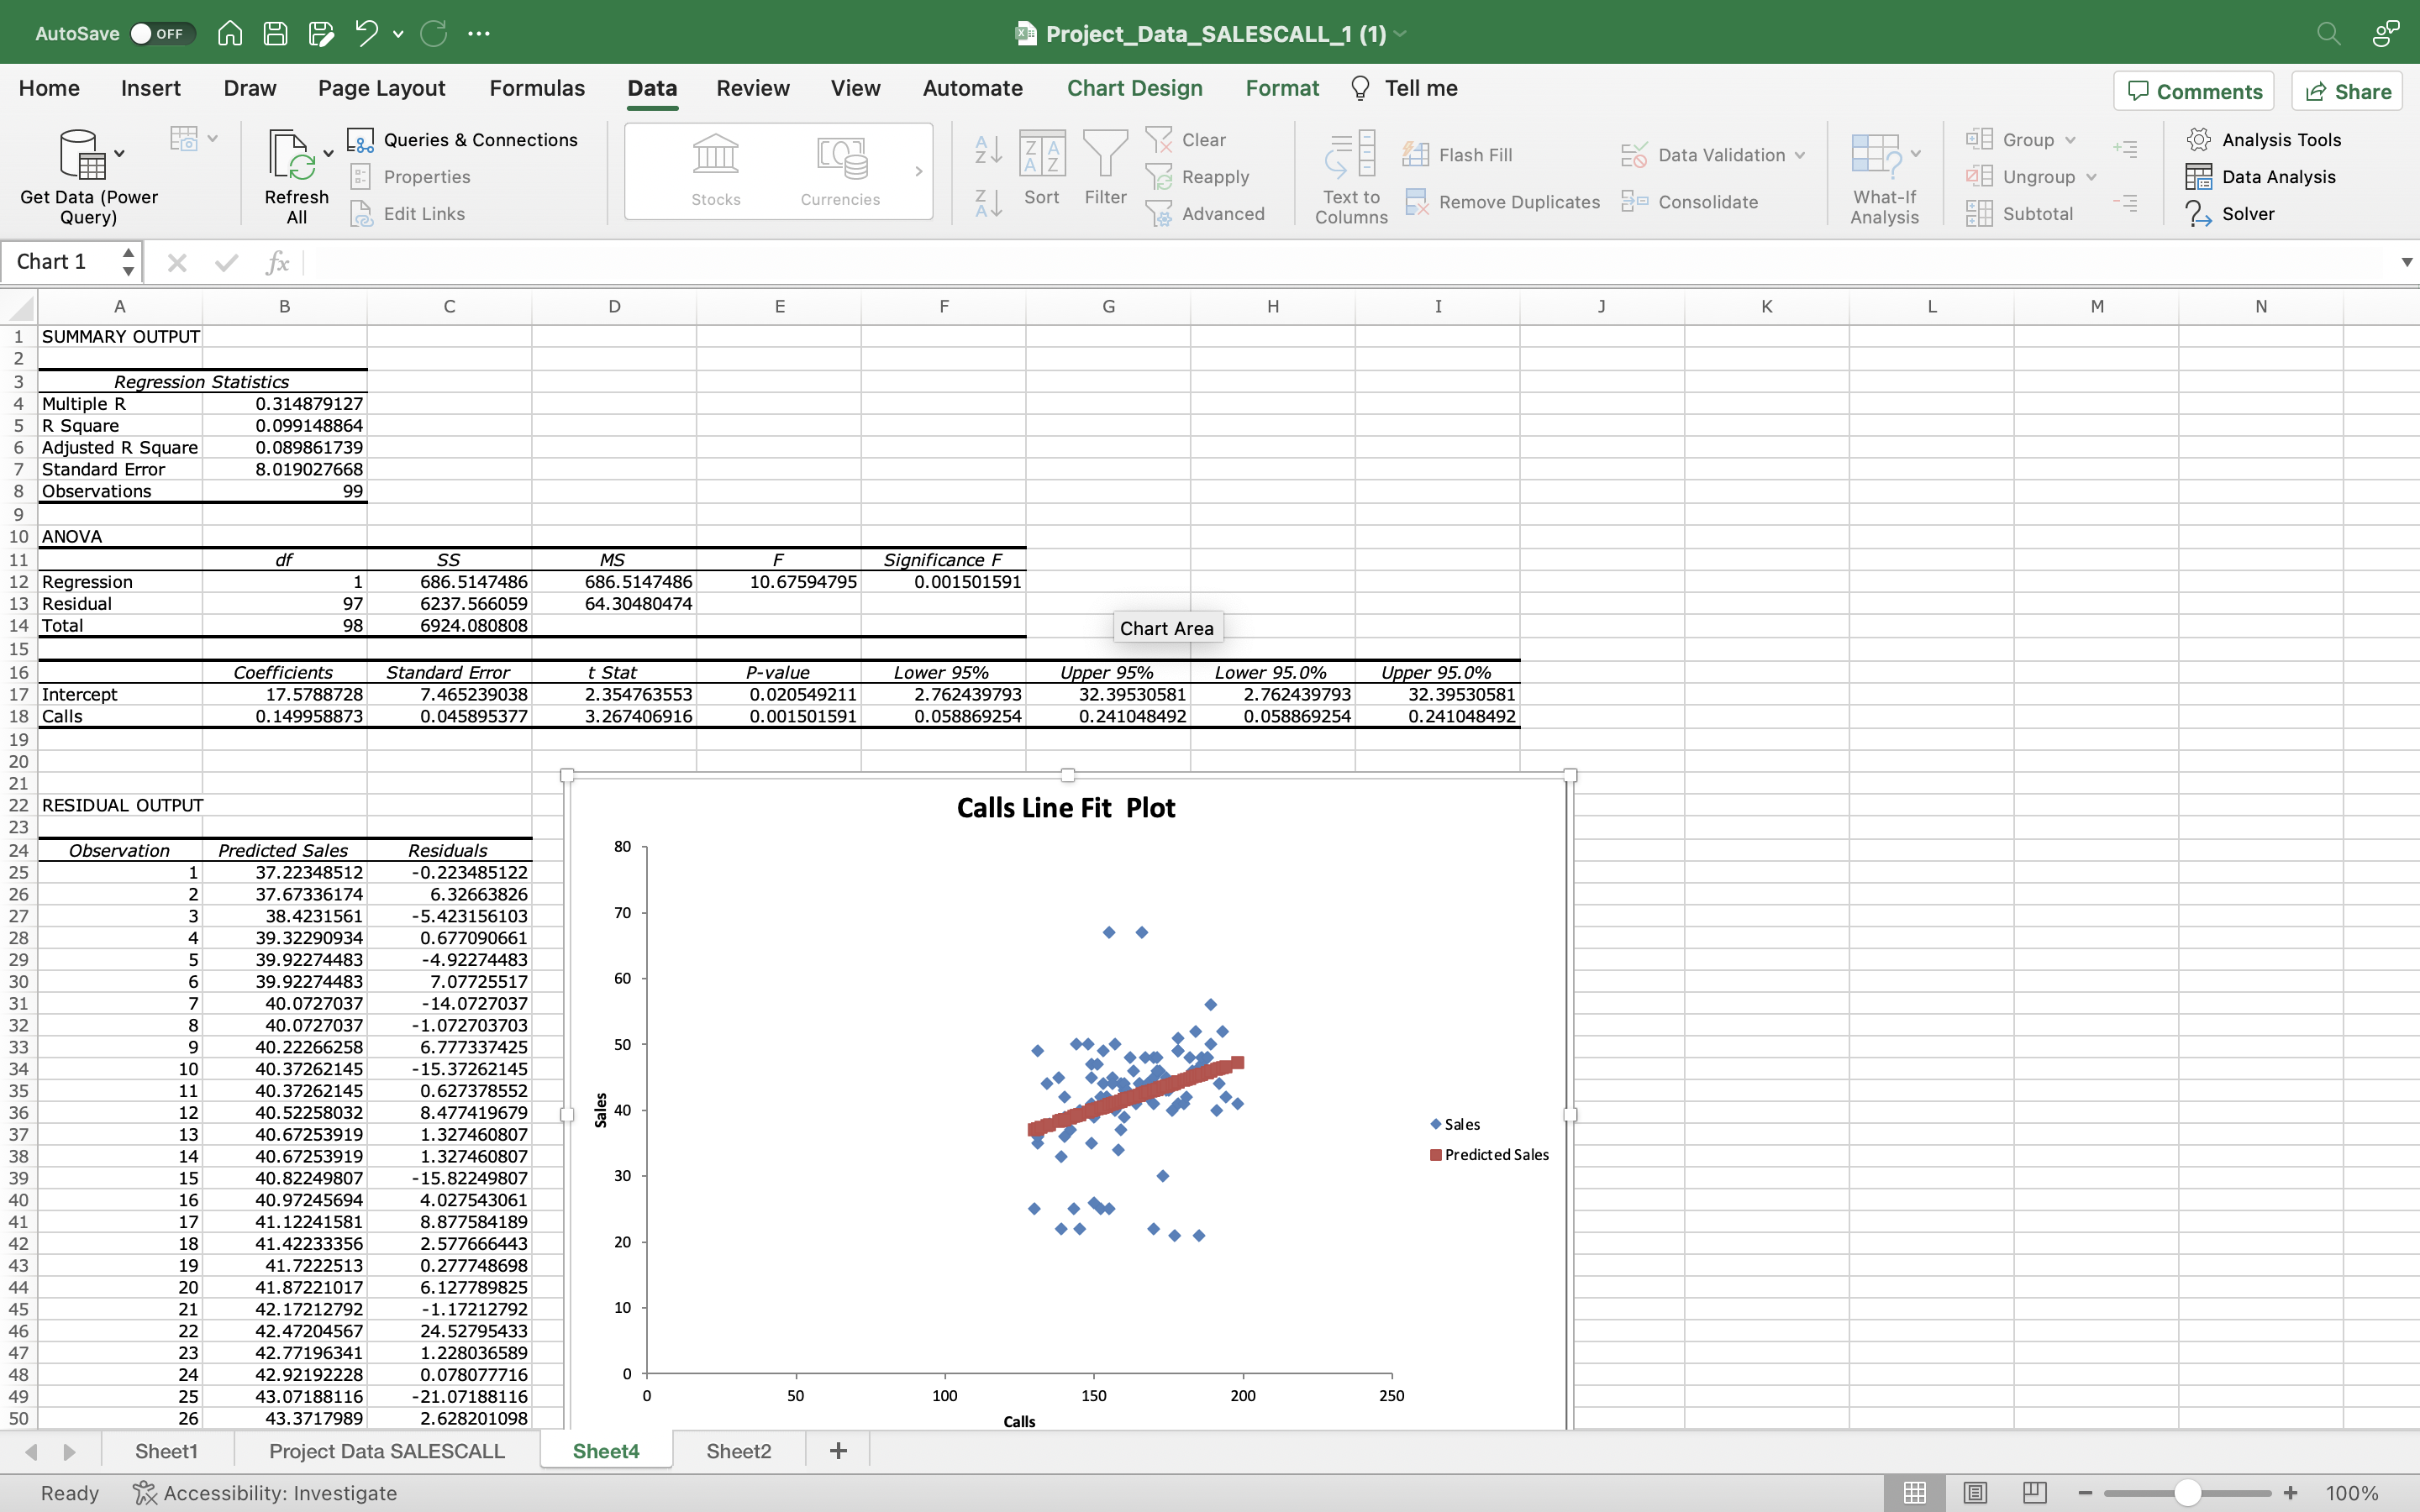
| SUMMARY OUTPUT | ||||||||
| Regression Statistics | ||||||||
| Multiple R | 0.314879127 | |||||||
| R Square | 0.099148864 | |||||||
| Adjusted R Square | 0.089861739 | |||||||
| Standard Error | 8.019027668 | |||||||
| Observations | 99 | |||||||
| ANOVA | ||||||||
| df | SS | MS | F | Significance F | ||||
| Regression | 1 | 686.5147486 | 686.5147486 | 10.67594795 | 0.001501591 | |||
| Residual | 97 | 6237.566059 | 64.30480474 | |||||
| Total | 98 | 6924.080808 | ||||||
| Coefficients | Standard Error | t Stat | P-value | Lower 95% | Upper 95% | Lower 95.0% | Upper 95.0% | |
| Intercept | 17.5788728 | 7.465239038 | 2.354763553 | 0.020549211 | 2.762439793 | 32.39530581 | 2.762439793 | 32.39530581 |
| Calls | 0.149958873 | 0.045895377 | 3.267406916 | 0.001501591 | 0.058869254 | 0.241048492 | 0.058869254 | 0.241048492 |
Step by Step Solution
There are 3 Steps involved in it
1 Expert Approved Answer
Step: 1 Unlock

Question Has Been Solved by an Expert!
Get step-by-step solutions from verified subject matter experts
Step: 2 Unlock
Step: 3 Unlock