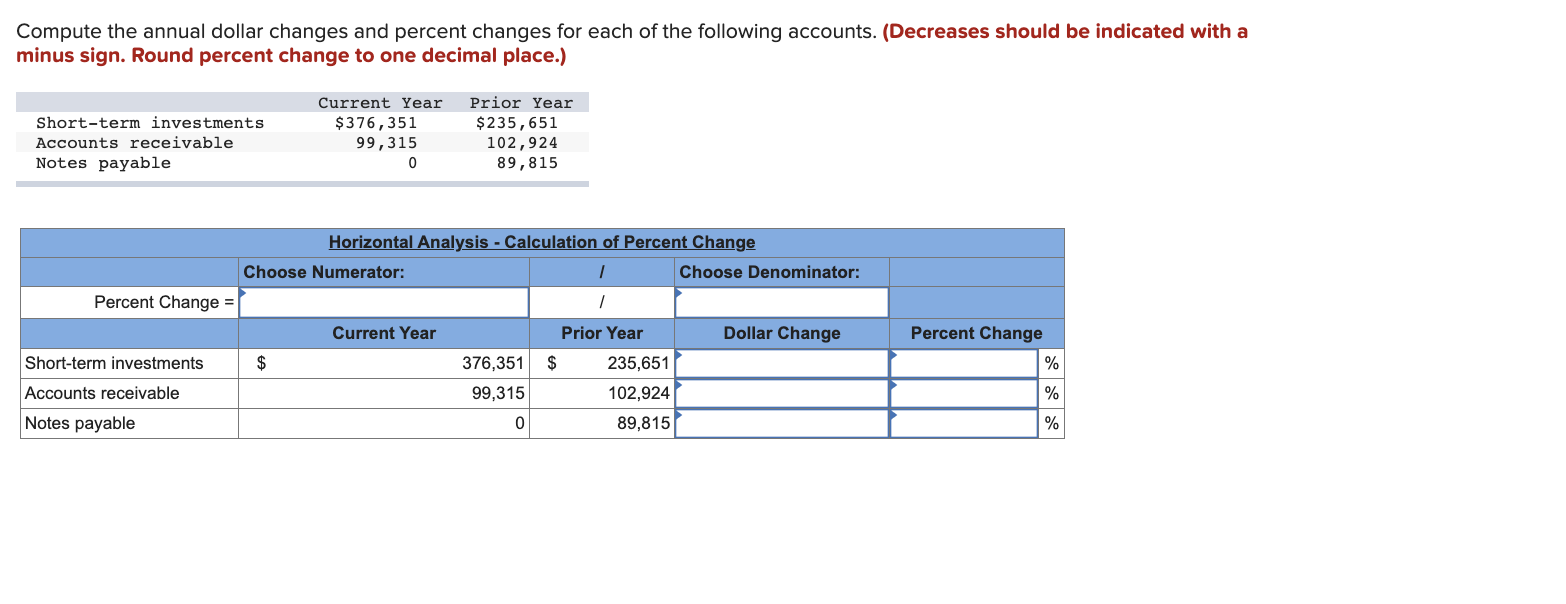
Question: Compute the annual dollar changes and percent changes for each of the following accounts. (Decreases should be indicated with a minus sign. Round percent change
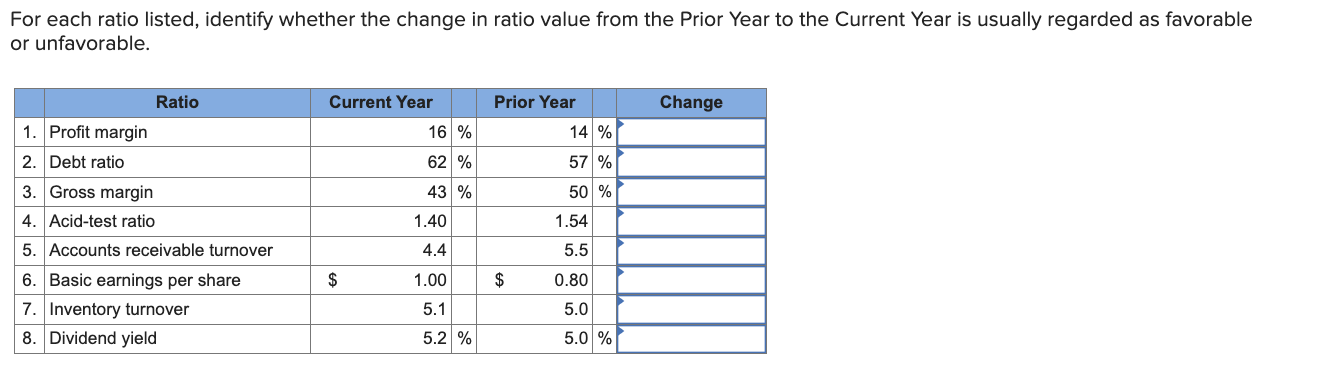
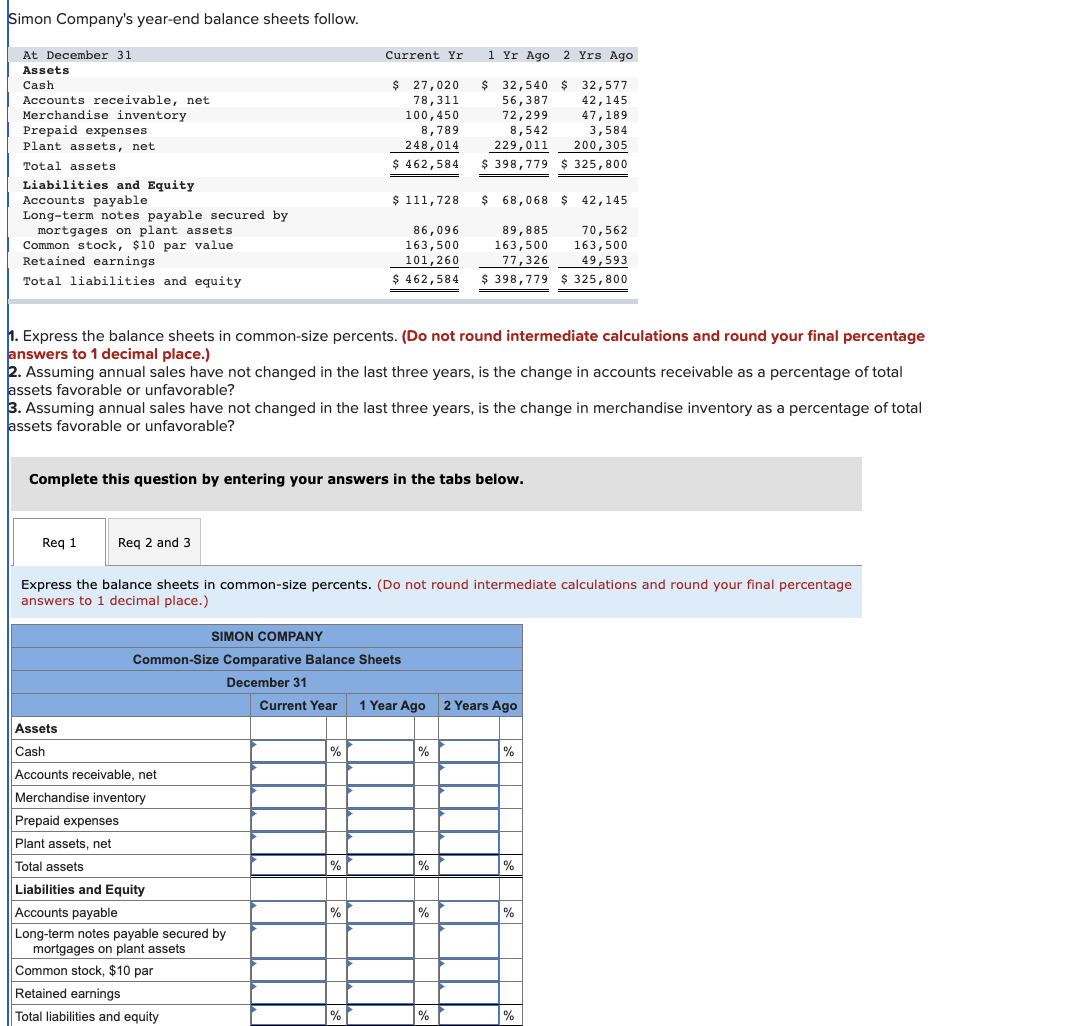
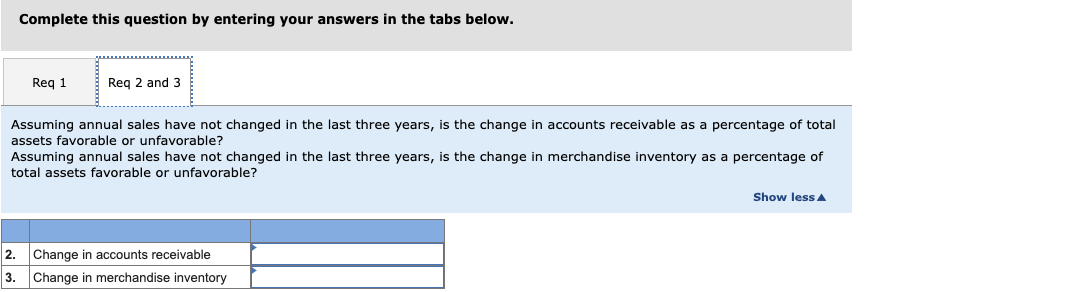
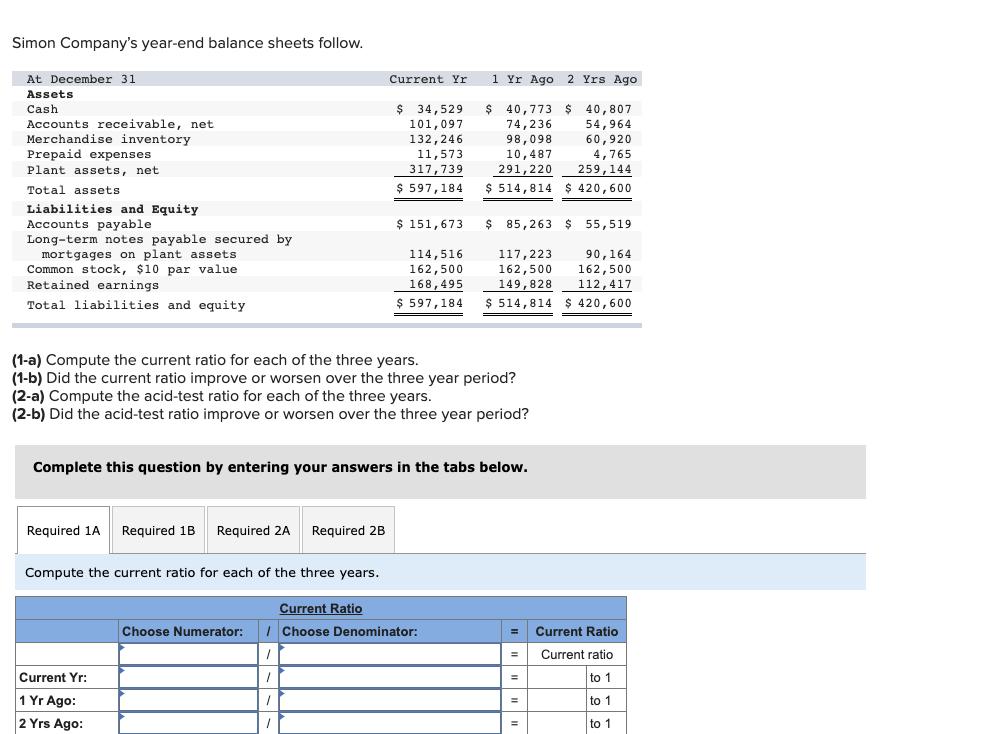
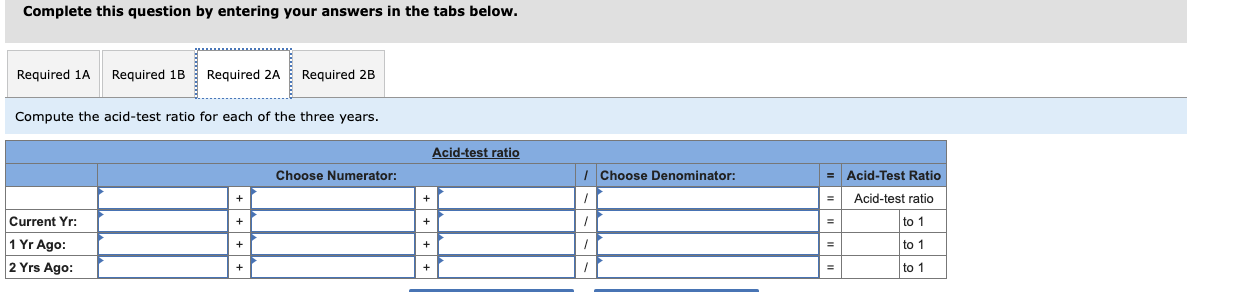
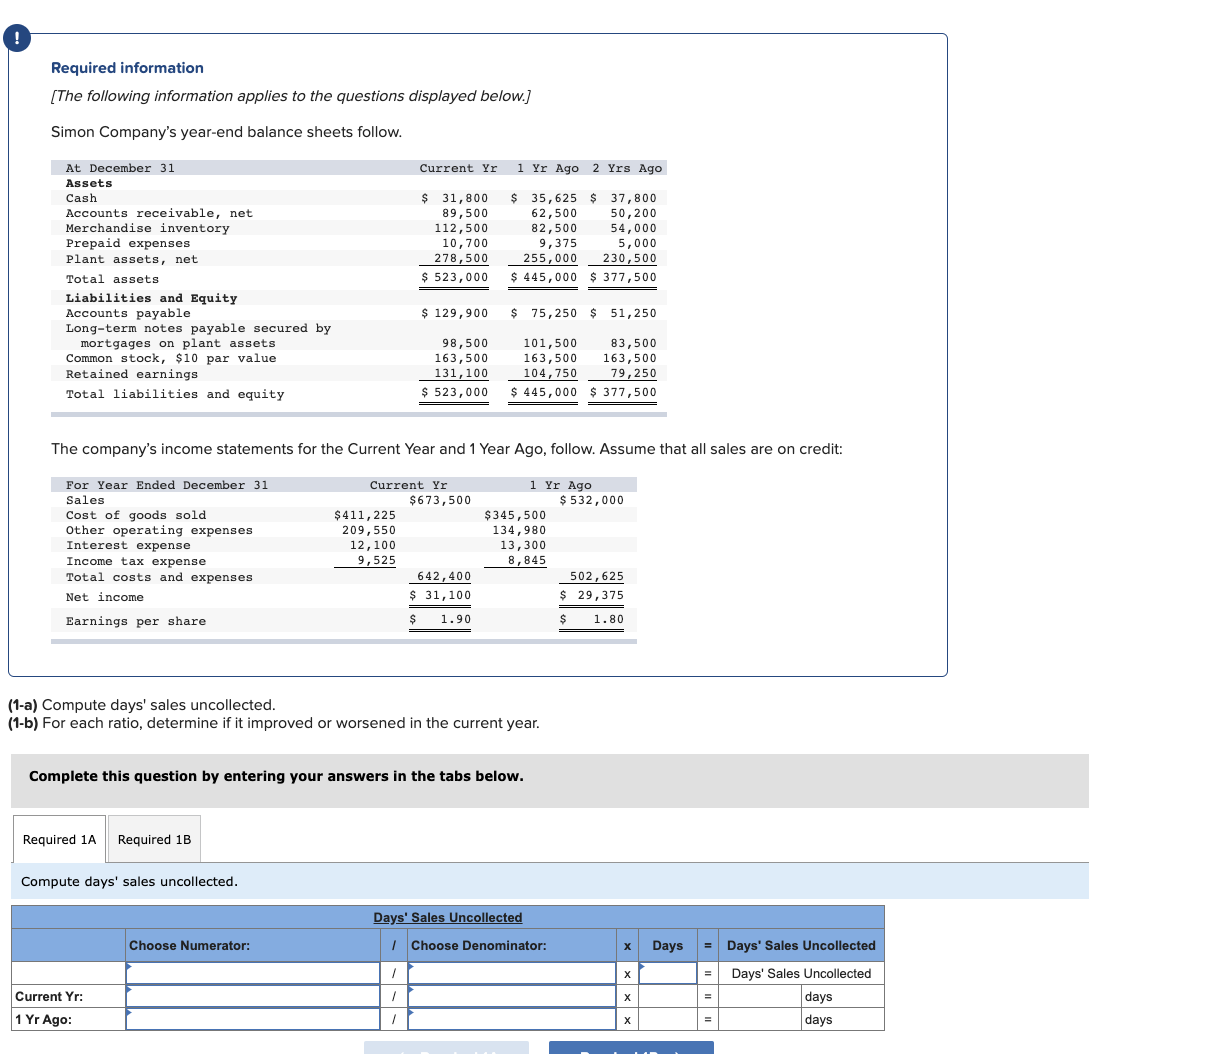
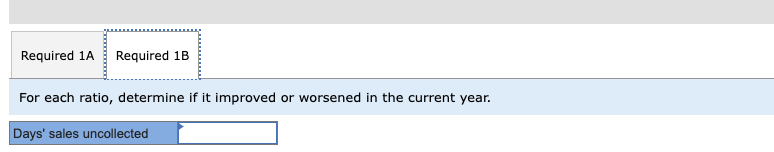
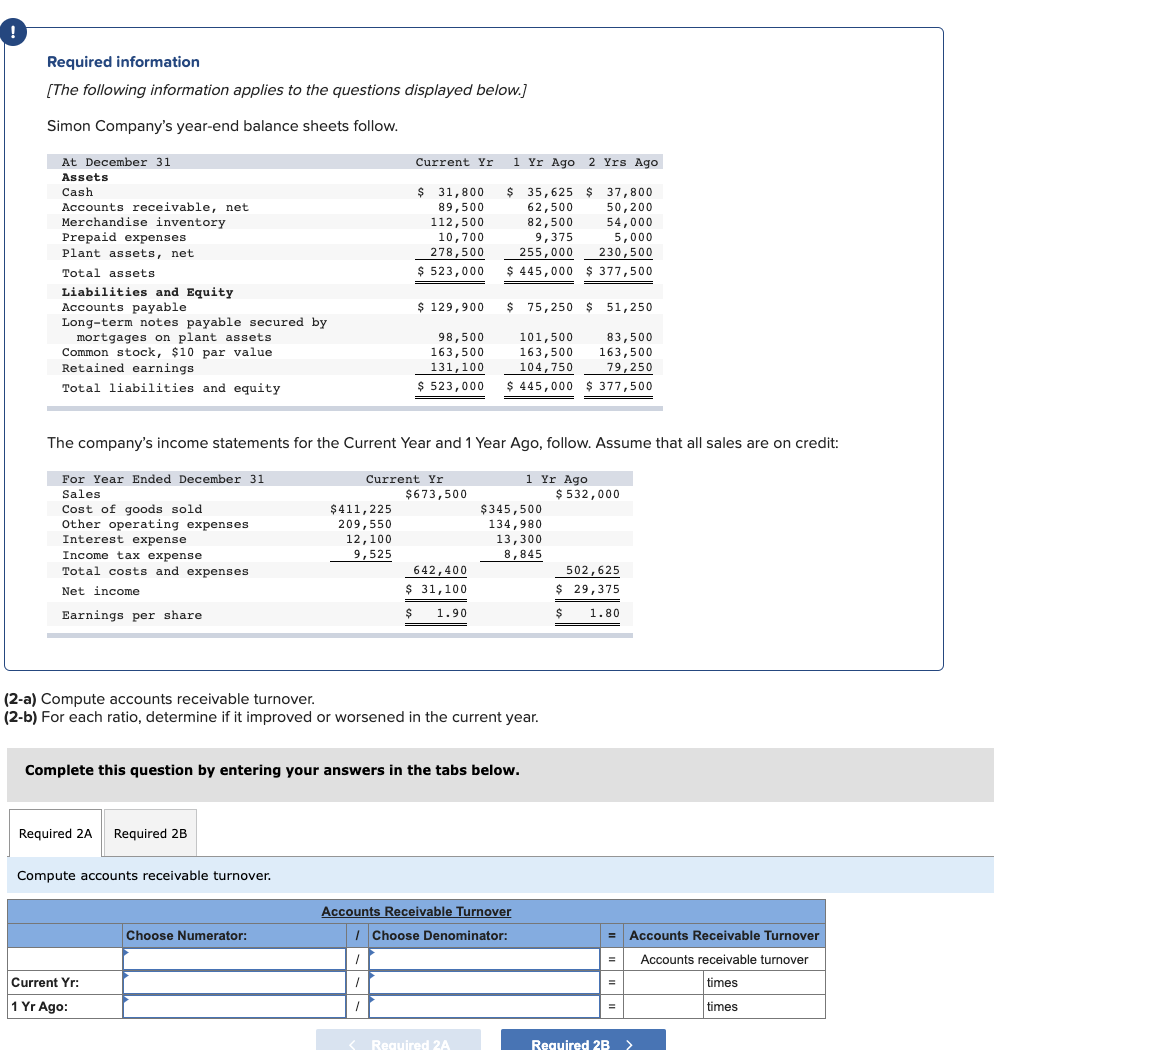
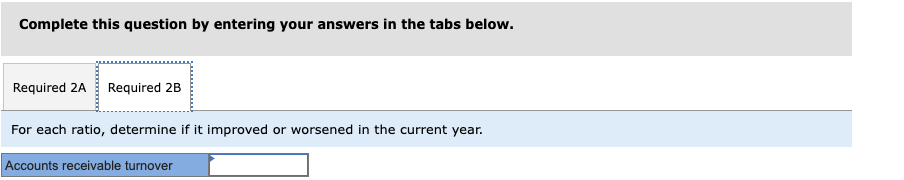
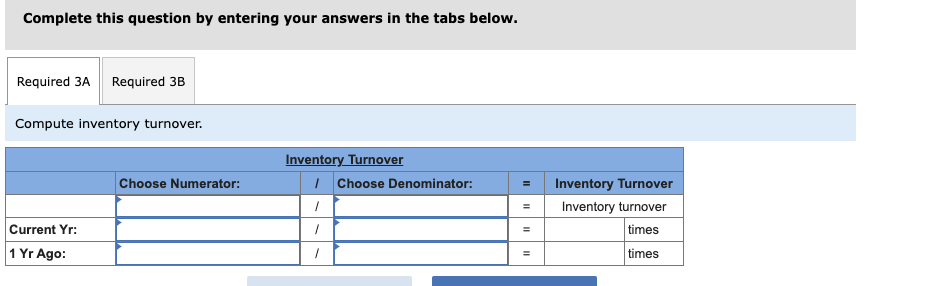
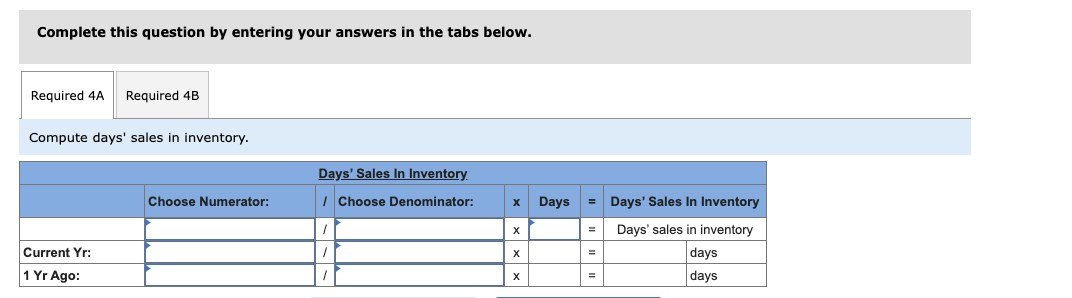
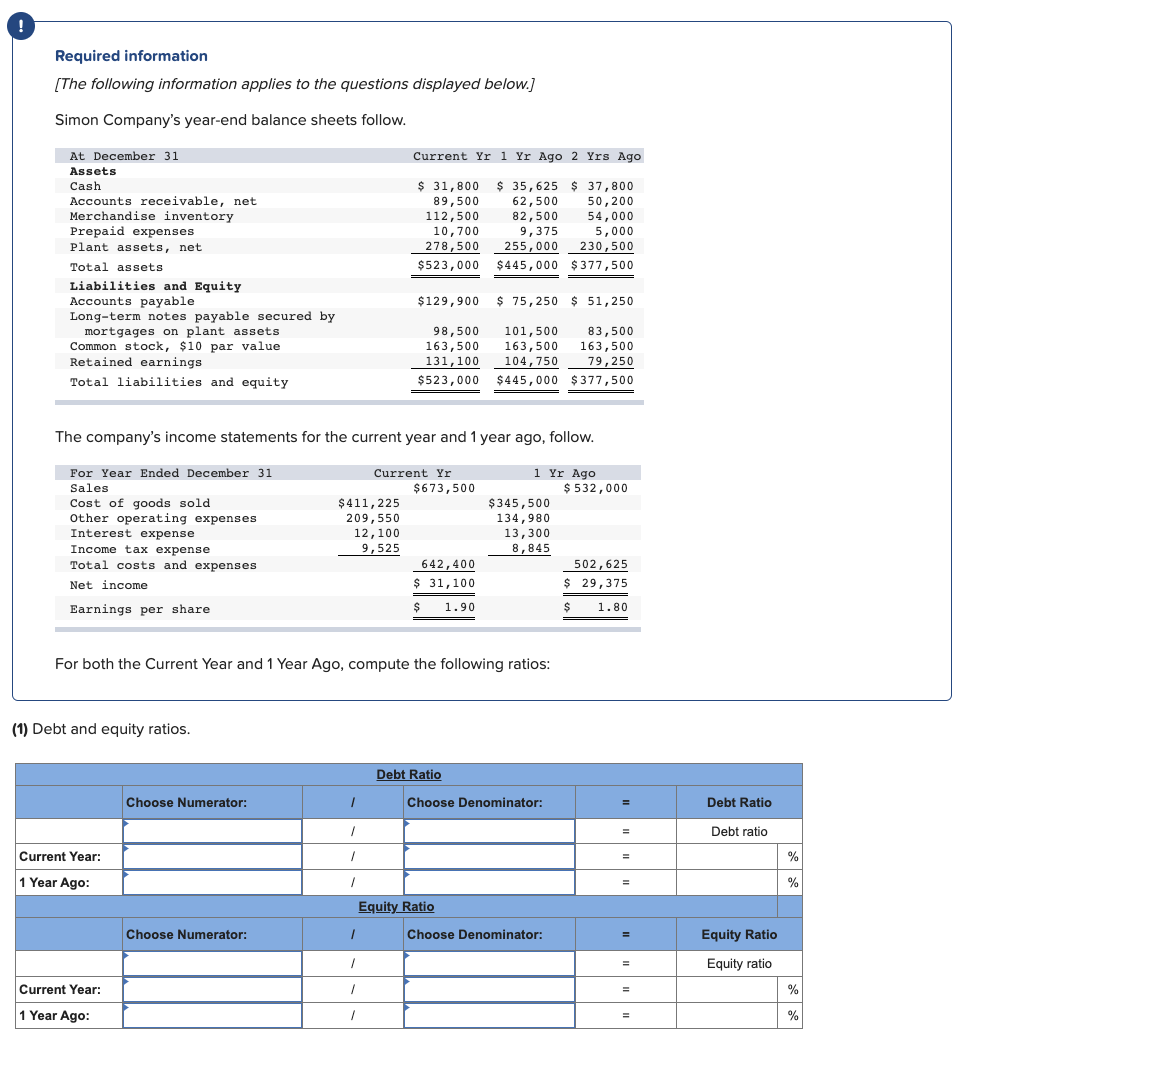
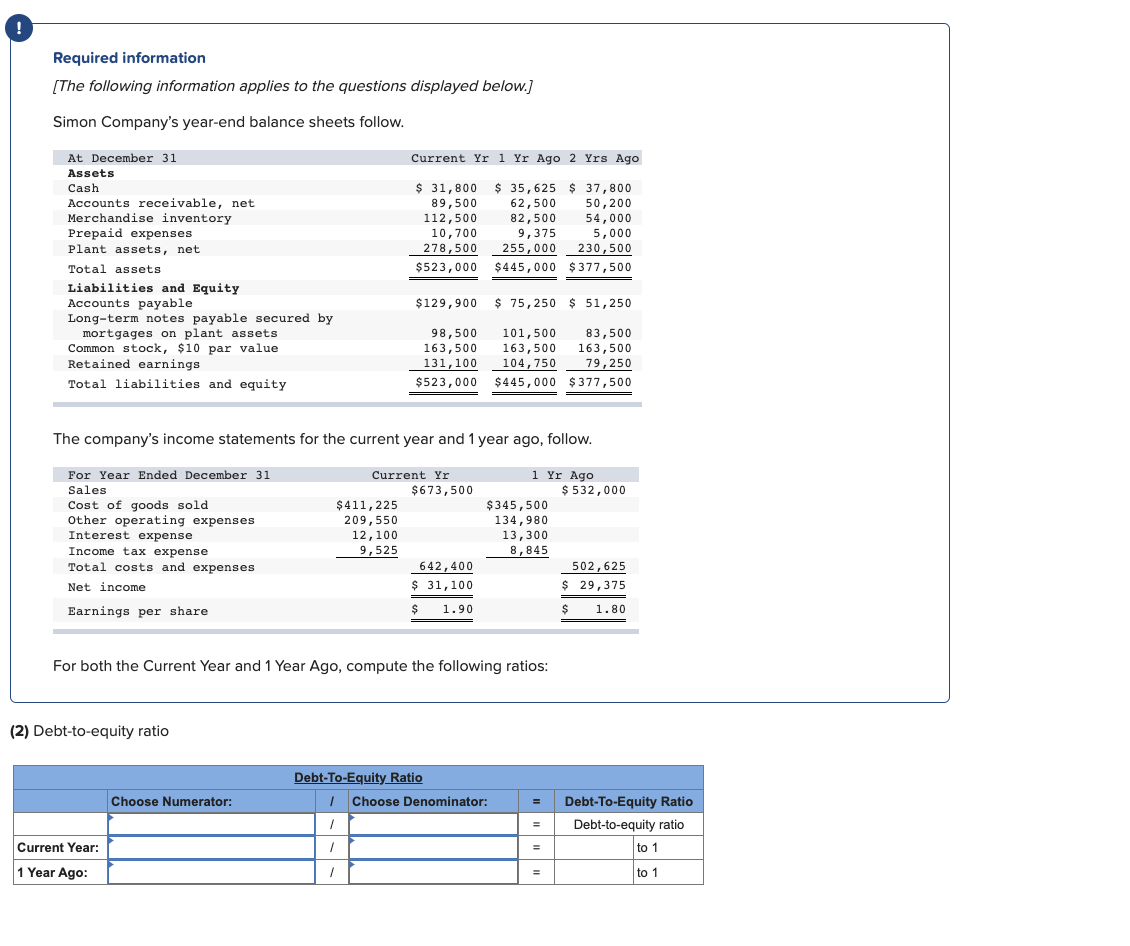
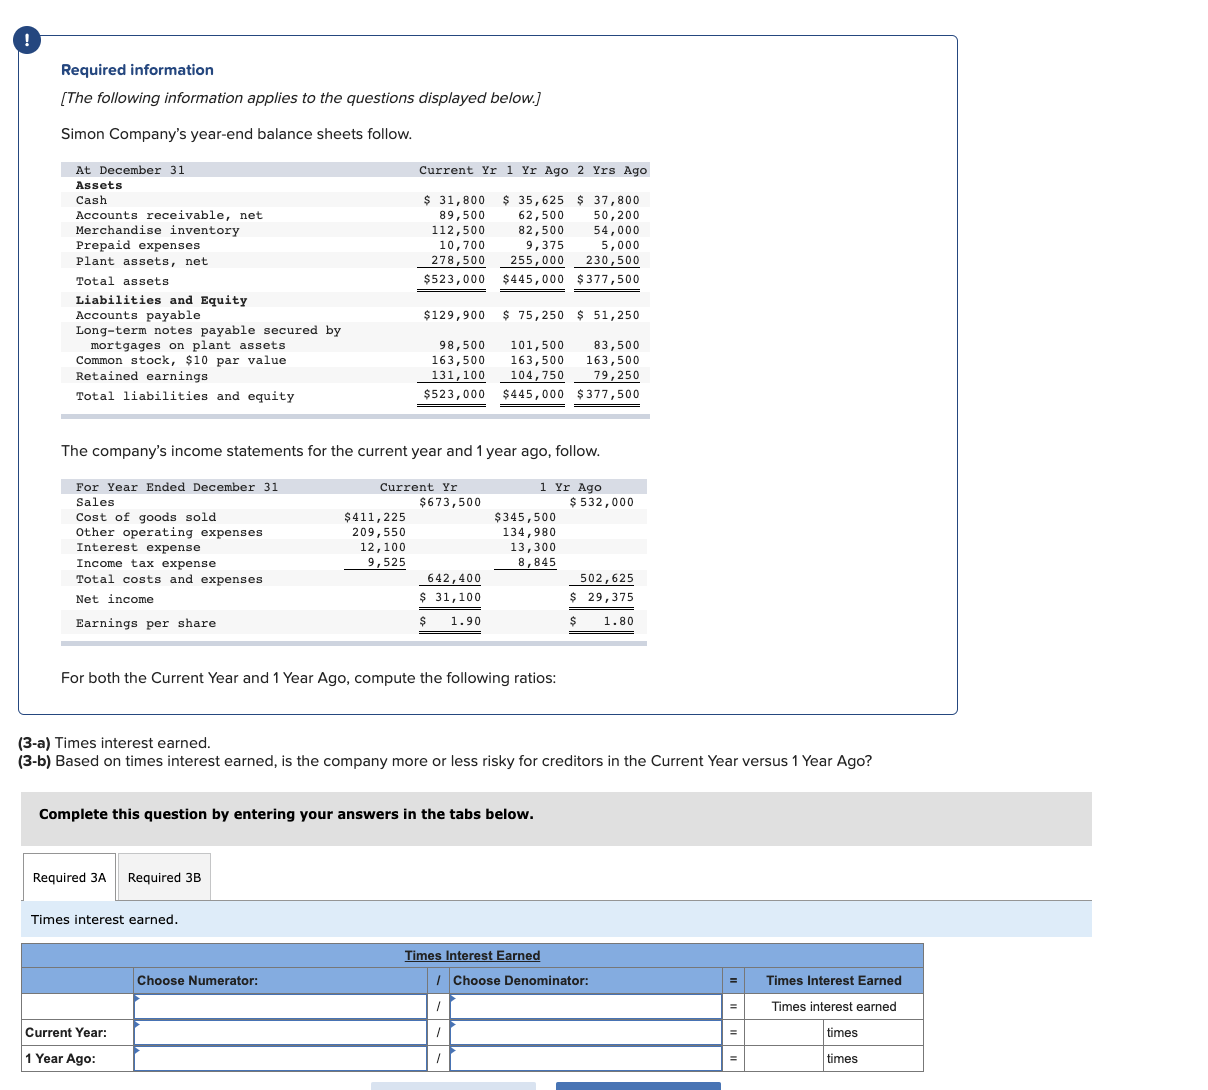
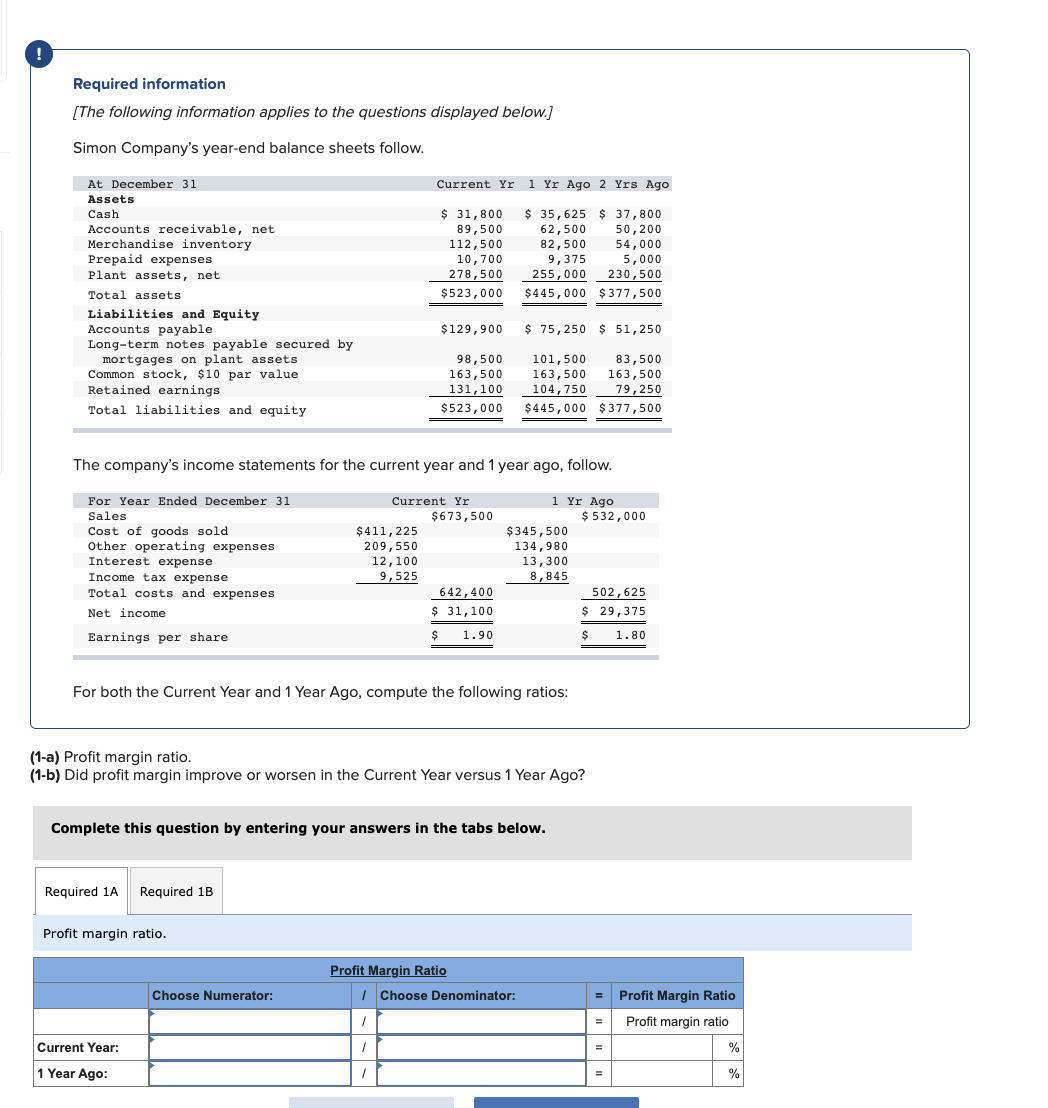
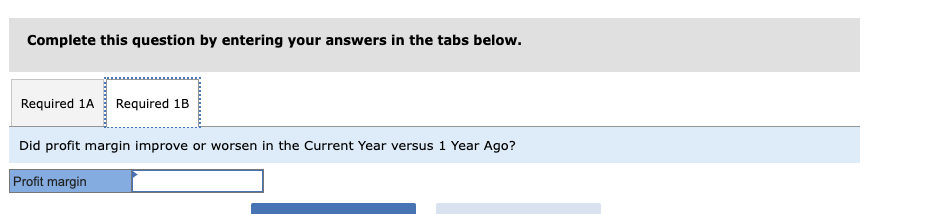
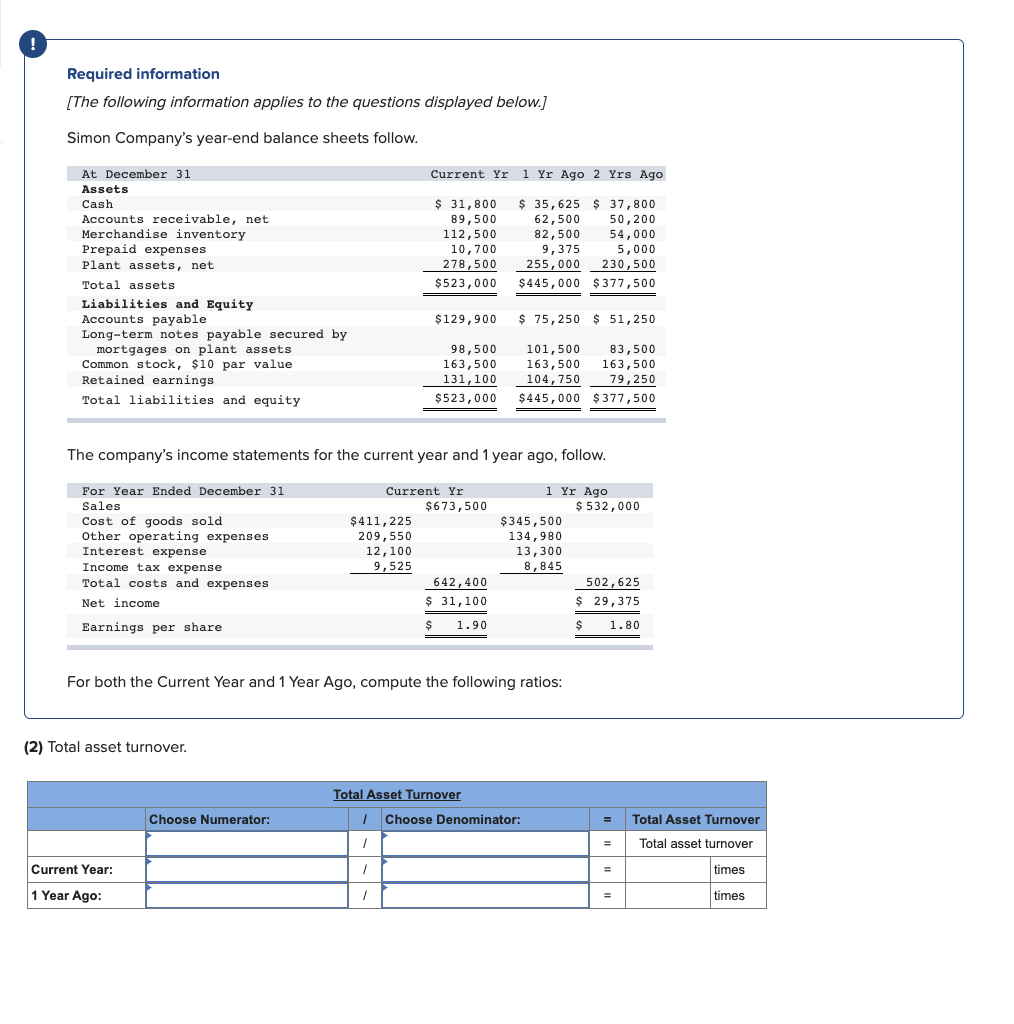
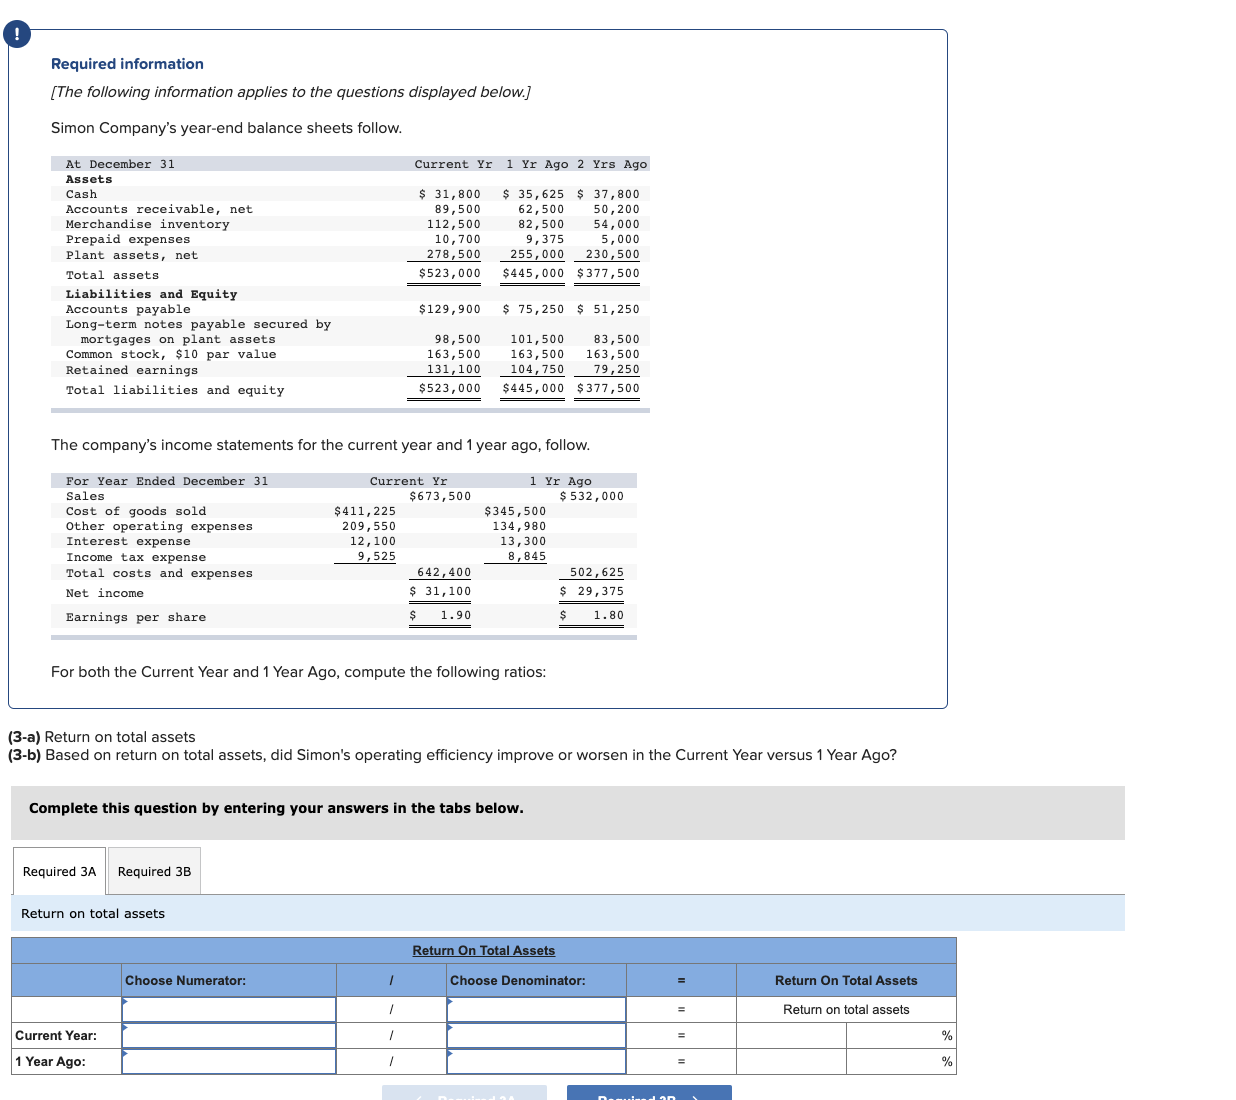
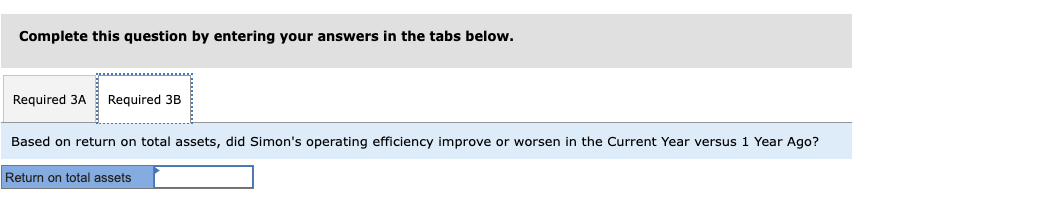
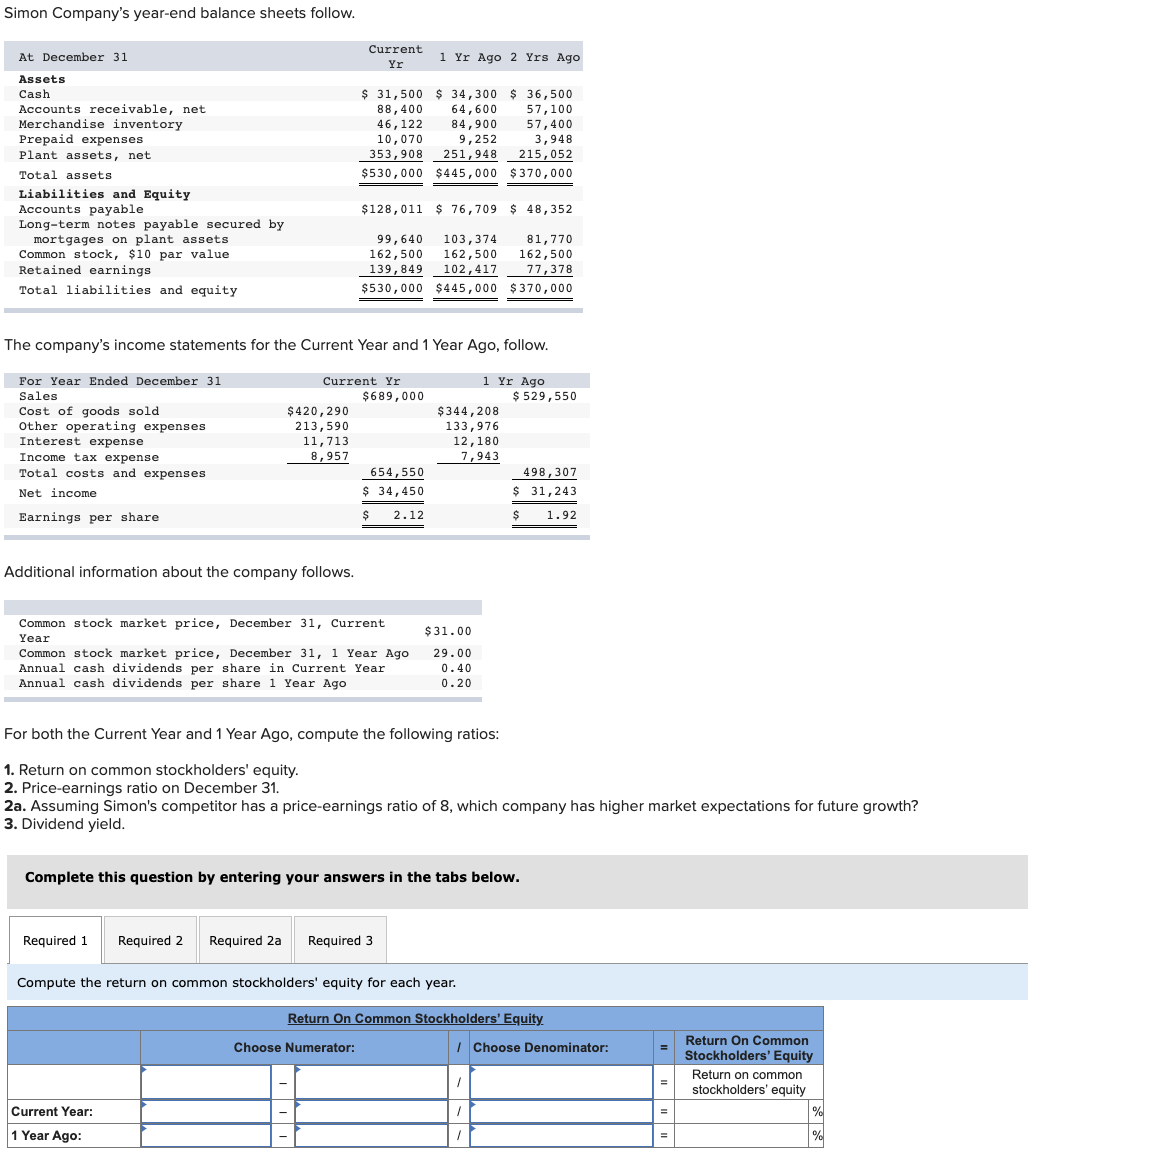
Compute the annual dollar changes and percent changes for each of the following accounts. (Decreases should be indicated with a minus sign. Round percent change to one decimal place.) Current Year Prior Year Shortterm investments $376,351 $235,651 Accounts receivable 99,315 102,924 Notes payable 0 59 , B 15 Percent Change = Short-term investments 376.351 Accounts receivable 99.315 102.924 Notes payable 0 89,815 For each ratio listed, identify whether the change in ratio value from the Prior Year to the Current Year is usually regarded as favorable or unfavorable. Prot margin 16 % 14 Debt ratio 62 \"A 5? Gross margin 43 % 50 Acid-lest ratio 1.40 1 .54 Accounts receivable turnover 4.4 5.5 Basic earnings per share $ 1.00 $ 0.80 Inventory turnover 5.1 5.0 Dividend yield 5.2 % 5.0 F'NF'P'PP'P'.' imon Company's year-end balance sheets follow. At December 31 Current 3?: 1 Yr Ago 2 Yrs Ago assets Cash $ 27,020 $ 32,540 5 32,57? Accounts receivable, net 73,311 56,337 42,145 Merchandise inventory 100,450 72,299 47,139 Prepaid expenses 3,789 3,542 3,534 Plant assets, net 240,014 229,011 200,305 Total assets $ 462,584 $ 393,779 s 325,800 Liabilities and Equity Accounts payable $ 111,728 $ 63,068 $ 42,145 Long-term notes payable secured by mortgages on plant assets 06,056 09,885 10,562 Common stock, $10 par value 153,500 153,500 163,500 Retained earnings 101,260 77,326 49,593 Total liabilities and equity 5 452:53'1 $ 393,779 3 325.800 . Express the balance sheets in common-size percents. {Do not round intermediate calculations and round your nal percentage nswers to 1 decimal place} . Assuming annual sales have not changed in the last three years. is the change in accounts receivable as a percentage of total ssets favorable or unfavorable? . Assuming annual sales have not changed in the last three years, is the change in merchandise inventory as a percentage oftotal ssets favorable or unfavorable? Complete this question by entering your answers In the tabs below. Reql Rquand3 EXPFEH the balance sheets in common-size percents. (Do not round Intermediate calculations and round your nal percentage answers to 1 decimal place.) Accounts receivable, net Merchandise inventory Prepaid expenses Plant assets. net Total assets Liabilities and Equity Accounts payable Longterm notes payable secured by mortgages on plant assets Common stock, $10 par Retained earnings Total liabilities and equity Complete thls question by entering your answers In the tabs below. Assuming annual sales have not changed in the last three years, Is the change in accounts receivable as a percentage of total assets Favorable or unfavorable? Assuming annual sales have not changed In the last three years, Is the change In merchandise inventory as a percentage of total assets favorable or unfavorable? Show less; Fnangegnamummcewanm Simon Company's year-end balance sheets follow. At December 31 Current Yr 1 Yr Ago 2 Yrs Ago Assets Cash $ 34,529 $ 40,773 5 411,807 Accounts receivable, net 101,097 74,236 54,964 Merchandise inventory 132,246 93,1198 611,920 Prepaid expenses 11,573 10,487 4,765 Plant assets, net 317,739 291,220 259,144 Total assets s 597, 184 $ 514,914 s 420,500 Liabilities and Equity Accounts payable $ 151,673 $ 85,263 S 55,519 Long-term notes payable secured by mortgages on plant assets 114,516 117,223 911,164 Common stock, $10 par value 162,500 162,500 162,500 Retained earnings 165,495 149,828 112,417 Total liabilities and equity $ 597; 184 $ 514,814 S 42111500 {1a} Compute the current ratio for each of the three years. {1-b) Did the current ratio improve or worsen over the three year period? {2-3) Compute the acid-test ratio for each of the three yea rs. {2-b) Did the acid-test ratio improve or worsen over the three year period? Complete thls question by entering your answers In the tabs below. Required 1A Required 13 Required 2A Required 23 Compute the current ratio for each of the three years. Current ratio to 1 to 1 to 1 Complete thls question by entering your answers In the tabs below. Required 1A Required 13 Required 2A Required 23 Did the current ratio Improve or worsen over the three year period? Surrent ratio Complete this question I11 entering your answers In the tabs below. Required 1A Required 13 Required 2A Required 23 Complete thls question by entering your answers In the tabs below. Required 1A Required 13 Required 2A Required 23 Did the acid-test ratio improve or worsen over the three year period? Acidlest ratio l l Required information {The foiiowing information applies to the questions displayed Detour} Simon Company's year-end balance sheets follow, At December 3]. Current Yr 1 Yr Ago 2 Yrs Ago Assets Cash 5 31,300 $ 35,625 5 37,000 Accounts receivable, net 89,500 62,500 50,200 Merchandise inventory 112,500 02,500 54,000 Prepaid expenses 10,700 9,375 5,000 Plant assets, net 273,500 255,000 230,500 Total assets $ 523,000 $ 445,000 s 377,500 Liabilities and Equity Accounts payable 5 129,900 $ 75,250 S 51,250 Long-term notes payable secured by mortgages on plant assets 93,500 101,500 33,500 Common stock, $10 par value 163,500 163,500 163,500 Retained earnings 131,100 104,350 39,250 Total liabilities and equity 5 523,000 $ 445,000 5 337.500 The company's income statements for the Current Year and 1 Year Ago, follow. Assume that all sales are on credit: For Year Ended. December 31 Current [.1- 1 Yr Ago Sales $673,500 $532,000 Cost of goods sold $411,225 $345,500 Other operating expenses 209,550 134,930 Interest expense 12,100 13,300 Income tax expense 9,525 0,345 Total costs and expenses 642,400 502,625 Net income 5 31,100 $ 29,375 Earnings per share $ 1-90 5 1-50 {1a) Compute days' sales uncollected. {1-b) For each ratio, determine if it improved or worsened in the current year. complete thls queson by entering your answers In the tabs below. Required 1A Required 13 Compute days' sales uncollected. Days' Sales Uncollected days days Required 1A Required 13 For each ratio, determine If It Improved or worsened In the current year. Required information [The following information applies to the questions displayed below: Jl Simon Company's year-end balance sheets follow. At December 31 Current Yr 1 Yr Ago 2 Yrs Ago Assets Cash $ 31,300 $ 35,625 5 37,300 Accounts receivable, net 09,500 62,500 50,200 Merchandise inventory 112,500 02,500 54,000 Prepaid expenses 10,700 9,375 5,000 Plant assets, net 273,500 255,000 230,500 Total assets $ 523,000 $ 445,000 s 337,500 Liabilities and Equity Accounts payable $ 129,900 $ 75,250 S 51,250 Long-term notes payable secured by mortgages on plant assets 93,500 101,500 33,500 Common stock, $10 par value 163,500 163,500 163,500 Retained earnings 131,100 104,750 79,250 Total liabilities and equity $ 523,000 $ 445.000 S 377:590 The company's income statements for the Current Year and 1 Year Ago. follow. Assume that all sales are on credit: For Year Ended December 31 Current Yr 1 Yr Ago Sales $573,500 $532,000 Cost of goods sold $411,225 $345,500 Other operating expenses 209,550 134,980 Interest expense 12,100 13,300 Income tax expense 9,525 3,345 Total costs and expenses 642,400 502,625 Net income $ 31:1'30 $ 291-375 Earnings per share $ 1-95 $ 1.00 {2-3} Compute accounts receivable turnover. {243) For each ratio. determine if it improved or worsened in the current year. Complete thls question by entering your answers In the tabs below. Required 2A Required 23 Compute accounts receivable turnover. Accounts receivable turnover times times Complete thls question by entering your answers In the tabs below. Required 2A Required 23 For each ratio, determine If It improved or worsened In the current year. \fComplete thls question by entering your answers In the tabs below. Required 3A Required BB For each ratio, determine If It Improved or worsened In the current year. Complete thls quesnn by entering your answers In the tabs below. Required 4A Required 43 Compute days' sales in Inventory. Days' sales in inventory days days K II >6 II Complete thls question by entering your answers In the tabs below. Required 4A Required 43 For each ratio, determine If It Improved or worsened In the current year. Required information At December 31 Assets Cash Accounts receivable, net Merchandise inventory Prepaid expenses Plant assets, net Total assets Liabilities and Equity Accounts payable Long-term notes payable secured by mortgages on plant assets Common stock, $10 par value Retained earnings Total liabilities and equity For Year Ended December 31 Sales Cost of goods sold Other operating expenses Interest expense Income tax expense Total costs and expenses Net income Earnings per share Simon Company's year-end balance sheets follow. Current Yr $411,225 209,550 12,100 9,525 {The foiiowing information applies to the questions displayed beiom} Current Yr 1 Yr Ago 2 Yrs Ago $ 31,300 $ 35,625 $ 33,000 09,500 62,500 50,200 112,500 02,500 54,000 10,300 9,335 5,000 230,500 255,000 230,500 $523,000 $445,000 $333,500 $129,900 $ 35,250 $ 51,250 90,500 101,500 33,500 163,500 163,500 163,500 131,100 104,350 39,250 $523,000 $445,000 $333,500 The company's income statements for the current year and 1 year ago, follow. 1 Yr Ago $673,500 $532,000 $345,500 134,930 13,300 3,345 642,400 502,625 $ 31,100 $ 29,335 $ 1.90 $ 1.00 For both the Current Year and 1 Year Ago, compute the following ratios: {1} Debt and equity ratios. Current Year: Current Year: Equity ratio Required information [The foiiowing information applies to the questions displayed beiow} Simon Company's year-end balance sheets follow. At December 31 Current Yr 1 Yr Ago 2 Yrs Ago Assets Cash $ 31,300 $ 35,625 5 37,000 Accounts receivable, net 09,500 62,500 50,200 Merchandise inventory 112,500 02,500 54,000 Prepaid expenses 10,700 9,375 5,000 Plant assets, net 270,500 255,000 230,500 Total assets $523,000 $445,000 $337,500 Liabilities and Equity Accounts payable $129,900 $ 75,250 S 51,250 Long-term.notes payable secured by mortgages on plant assets 90,500 101,500 33,500 Common stock, $10 par value 163,500 163,500 163,500 Retained earnings 131,100 104,750 79,250 Total liabilities and equity $523,000 $445,000 $377.500 The company's income statements for the current year and 1 year ago, follow. For Year Ended December 31 Current Yr 1 Yr Ago Sales $573,500 $532,000 Cost of goods sold $411,225 $345,500 Other operating expenses 209,550 134,980 Interest expense 12,100 13,300 Income tax expense 9,525 3,345 Total costs and expenses 642,400 502,625 Net income $ 31,100 $ 29,375 Earnings per share $ 1-95 $ 1-30 For both the Current Year and 1 Year Ago, compute the following ratios: {2} Debt-to-equity ratio Debttoequity ratio m1 m1 Current Year: 1 Year Ago: Required information At December 31 Ale-ts Cash Accounts receivable, net Merchandise inventory Prepaid expenses Plant assets, net Total assets Liabilities Ind Equity Accounts payable Long-term notes payable secured by mortgages on plant assets Common stock, $10 par value Retained earnings Total liabilities and equity For Year Ended December 31 Sales Cost of goods sold Other operating expenses Interest expense Income tax expense Total costs and expenses Net income Earnings per share [The following information applies to the questions displayed below: ,1 Simon Company's year-end balance sheets follow. Current Yr 1 Yr Ago 2 Yrs Ago $ 31,300 $ 35,625 5 37,500 09,500 52,500 50,200 112,500 02,500 54,000 10,700 9,375 5,000 275,500 255,000 230,500 $523,000 $445,000 $3T7,500 $129,900 $ 75,250 S 51,250 90,500 101,500 33,500 153,500 153,500 163,500 131,100 104,750 79,250 $523,000 $445,000 $3T7,500 The company's income statements for the current year and 1 year ago, follow. Current Yr 1 Yr Ago $573,500 $532,000 $411,225 $345,500 209,550 134,930 12,100 13,300 9,525 9,345 542,400 502,625 $ 31,100 s 29,375 $ 1.90 $ 1.00 For both the Current Year and 1 Year Ago, compute the following ratios: {3-a] Times interest earned. {3-13} Based on times interest earned, is the company more or less risky for creditors in the Current Year versus 1 Year Ago? complete this question try entering your answers In the tabs below. Required 3A Required 33 Times Interest earned. Current Year: 1 Year Ago: Times interest earned times times \f0 Required information [The following infomation applies to the questions displayed below} Simon Company's year-end balance sheets follow. At December 31 Current Yr 1 Yr Ago 2 Yrs Ago Assets Cash 5 31,000 $ 35,625 5 37,000 Accounts receivable, net 39,500 52,500 50,200 Merchandise inventory 112,500 02,500 54,000 Prepaid expenses 10,300 9,375 5,000 Plant assets, net 278,500 255,000 230,500 Toma assets $523,000 $445,000 $377,500 Liabilities and Equity Accounts payable $129,900 $ 75,250 3 51,250 Long-term notes payable secured by mortgages on plant assets 98,500 101,500 33,500 Common stock, $10 par value 163,500 163,500 163,500 Retained earnings 131,100 104,350 79,250 Total liabilities and equity $523,000 $445,000 5337.500 The com pany's income statements for the current year and 1 year ago. follow. For Year Ended December 31 Current Yr 1 Yr Ago Sales $573,500 $532,000 Cost of goods sold $411,225 $345,500 Other operating expenses 209,550 134,980 Interest expense 12,100 13,300 Income tax expense 9,525 3,345 ll'otal costs and expenses 642,400 502,625 Net income $ 317100 $ 297-375 Earnings per share $ 1-95 $ 1-39 For both the Current Year and 1 Year Ago, compute the following ratios: {1-a] Prot margin ratio. {1-b) Did prot margin improve or worsen in the Current Year versus 1 Year Ago? Complete this question by entering your answers In the tabs below. Required 1A Required 13 Prot margin ratio. Prot margin ratio % % Current Year: 1 Year Ago: Complete thls question by entering your answers In the tabs below. Required 1A Required 1B Did prot margin Improve or worsen in the Current Year versus 1 Year Ago? _:I Required information [The following information applies to the At December 31 Assets Cash Accounts receivable, net Merchandise inventory Prepaid expenses Plant assets, net Total assets Liabilities and Equity Accounts payable Long-term notes payable secured by mortgages on plant assets Common stock, $10 par value Retained earnings Total liabilities and equity For Year Ended December 31 Sales Cost of goods sold other operating expenses Interest expense Income tax expense Total costs and expenses Net income Earnings per share questions displayed below. Jl Simon Company's year-end balance sheets follow. Current Yr 1 Yr Ago 2 Yrs Ago $ 31,300 $ 35,625 $ 37,000 39,500 52,500 50,200 112,500 02,500 54,000 10,700 9,375 5,000 273,500 255,000 230,500 $523,000 $445,000 $377,500 $129,900 $ 75,250 $ 51,250 93,500 101,500 33,500 163,500 163,500 163,500 131,100 104,750 79,250 $523,000 $445,000 $377,500 The company's income statements for the current year and 1 year ago, follow. Current Yr 1 Yr Ago $573,500 $532,000 $411,225 $345,500 209,550 134,930 12,100 13,300 9,525 3,345 642,400 502,625 $ 31,100 $ 29,375 $ 1.90 $ For both the Current Year and 1 Year Ago, compute the following ratios: {2} Total asset turnover. Total asset tumover times times Required information Simon Company's year-end balance sheets follow. at December 31 assets Cash Accounts receivable, net Merchandise inventory Prepaid expenses Plant assets, net Total assets Liabilities and Equity Accounts payable Longterm notes payable secured by mortgages on plant assets Common stock, $10 par value Retained earnings Total liabilities and equity Total costs and expenses Net income Earnings per share [The following infomaon applies to the questions displayed below} Current Yr 1 Yr Ago 2 Yrs Ago 5 31,000 39,500 112,500 10,700 270,500 $523,000 $129,900 90,500 163,500 131,100 $523,000 For Year Ended December 31 Current Yr Sales $673,500 Cost of goods sold $411,225 Other operating expenses 209,550 Interest expense 12,100 Income tax expense 9,525 642,400 $ 31,100 $ 1.90 s 35,625 62,500 02,500 9,375 255,000 $445,000 $ 75,250 101,500 163,500 104,750 $445,000 1 Yr $ $345,500 134,980 13,300 9,345 5 37,000 50,200 54,000 5,000 230,500 $317,500 6 51,250 33,500 163,500 79,250 $377,500 The company's income statements for the current year and 1 year ago, follow, Ago 532,000 502,625 $ 5 For both the Current Year and 1 Year Ago, compute the following ratios: 29,375 1.00 {3a) Return on total assets 13-h} Based on return on total assets. did Simon's operating efciencyr improve or worsen in the Current Year versus 'I Year Ago? Complete thle question by entering your answers In the tabs below. Required 3A Required BB Return on total assets current Year: 1 Year Ago: Retum on total assets \fSimon Company's year-end balance sheets follow. Current At December 31 Yr 1 Yr Ago 2 Yrs Ago Assets Cash $ 31,500 $ 34,300 5 36,500 Accounts receivable, net 33,400 64,600 57,100 Merchandise inventory 46,122 04,900 57,400 Prepaid expenses 10,070 9,252 3,943 Plant assets, net 353,903 251,940 215,052 Total assets $530,000 $445,000 $330,000 Liabilities and Equity Accounts payable $123,011 $ 76,709 S 43,352 Long-term notes payable secured by mortgages on plant assets 99,640 103,374 31,770 Common stock, $10 par value 162,500 162,500 162,500 Retained earnings 139,349 102,417 77,373 Total liabilities and equity $530,000 $445,000 $370:000 The company's income statements for the Current Year and 1 Year Ago. follow. For Year Ended December 31 Current Yr 1 Yr Ago Sales $509,000 $529,550 Cost of goods sold $420,290 $344,200 Other operating expenses 213,590 133,976 Interest expense 11,713 12,130 Income tax expense 3,957 7,943 Total costs and expenses 654,550 493,307 Net income $ 347450 5 317243 Earnings per share $ 2.12 $ 1.92 Additional information about the company follows. Common stock market price, December 31, Current $31.00 Year Common stock market price, December 31, 1 Year Ago 29.00 Annual cash dividends per share in Current Year 0.40 Annual cash dividends per share 1 Year Ago 0.20 For both the Current Year and 1 Year Ago, compute the following ratios: 1. Return on common stockholders' equity. 2. Price-earnings ratio on December 31. 2e. Assuming Simon's competitor has a price-earnings ratio of 8, which company has higher market expectations for future growth? 3. Dividend yield. Complete thls question by entering your answers In the tabs below. Required 1 Required 2 Required 2a Required 3 Compute the return on common stockholders' equity For each year. Return on common stockholders' equity % % Current Year: 1 Year Ago
Step by Step Solution
There are 3 Steps involved in it
1 Expert Approved Answer
Step: 1 Unlock
Question Has Been Solved by an Expert!
Get step-by-step solutions from verified subject matter experts
Step: 2 Unlock
Step: 3 Unlock
Students Have Also Explored These Related Finance Questions!