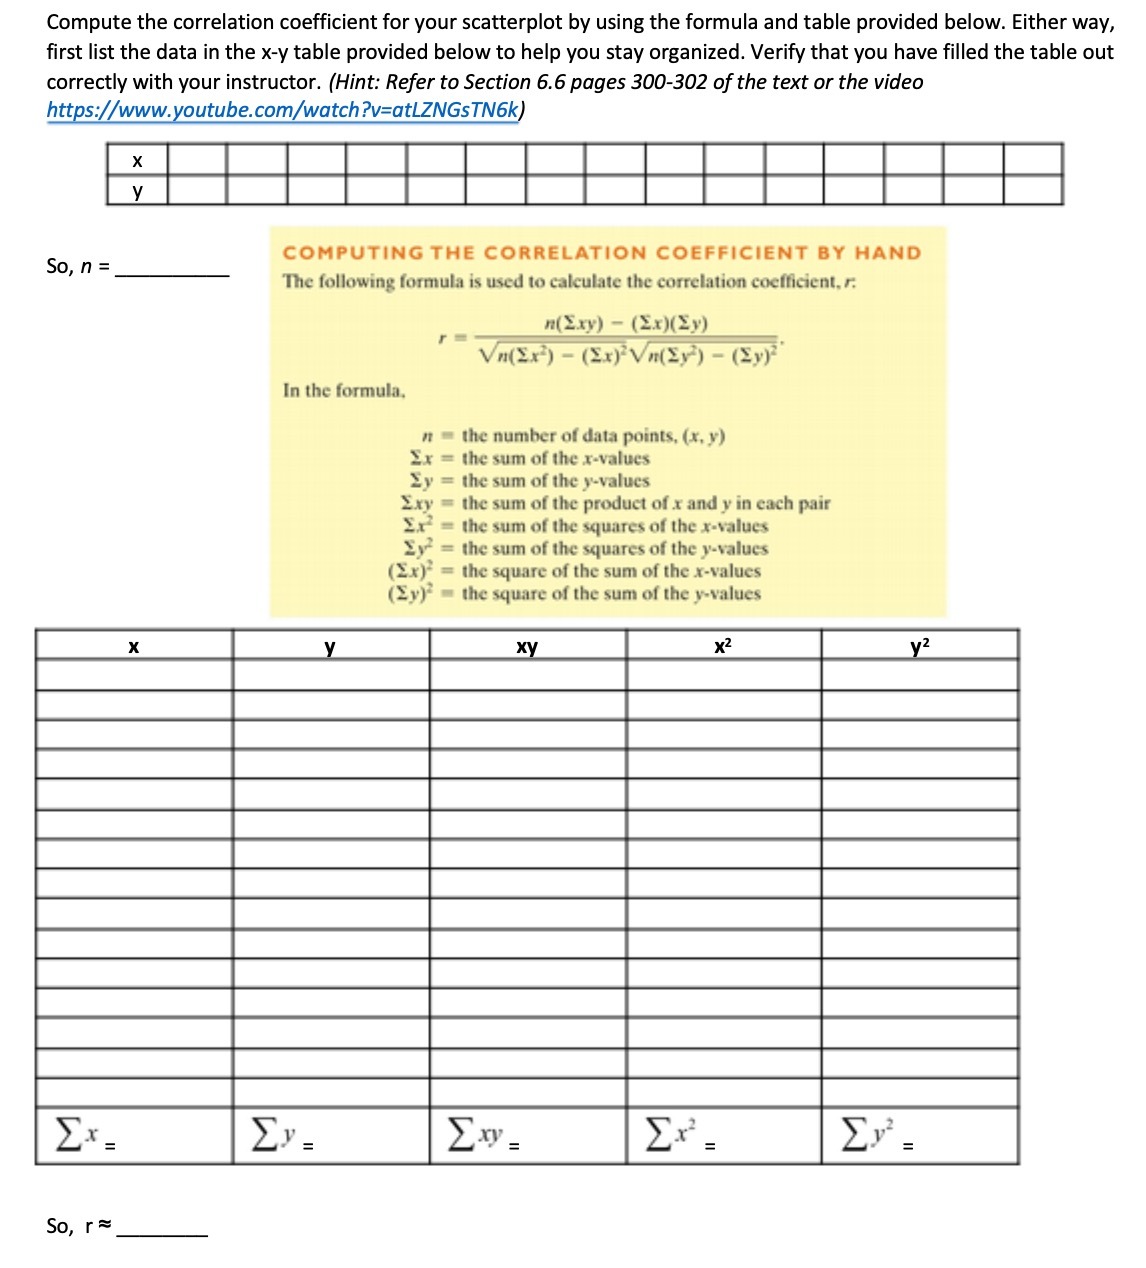
Question: Compute the correlation coefficient for your scatterplot by using the formula and table provided below. Either way, first list the data in the x-y table

Compute the correlation coefficient for your
Compute the correlation coefficient for your scatterplot by using the formula and table provided below. Either way, first list the data in the x-y table provided below to help you stay organized. Verify that you have filled the table out correctly with your instructor. (Hint: Refer to Section 6.6 pages 300-302 of the text or the video https://www.youtube.com/watch?v=atLZNGSTN6k) X So, n = COMPUTING THE CORRELATION COEFFICIENT BY HAND The following formula is used to calculate the correlation coefficient, r. n(Exy) - (Ex) (Ey) Vn( Ex ) - (Ex) Vn(ly) - (Ey) In the formula. " = the number of data points, (x, y) Ex = the sum of the x-values Ey = the sum of the y-values Exy = the sum of the product of x and y in each pair Ex = the sum of the squares of the x-values Ey = the sum of the squares of the y-values (Ex) = the square of the sum of the x-values (Ey) = the square of the sum of the y-values X y xy X2 yz Ex = Ey = So, r=

Step by Step Solution

There are 3 Steps involved in it

1 Expert Approved Answer
Step: 1 Unlock blur-text-image
Question Has Been Solved by an Expert!

Get step-by-step solutions from verified subject matter experts

Step: 2 Unlock
Step: 3 Unlock

Students Have Also Explored These Related Mathematics Questions!