

Question: Compute the cost assigned to ending inventory using (a) FIFO, (b) LIFO, (c) weighted average, and ( d ) specific identification. (For specific identification, units
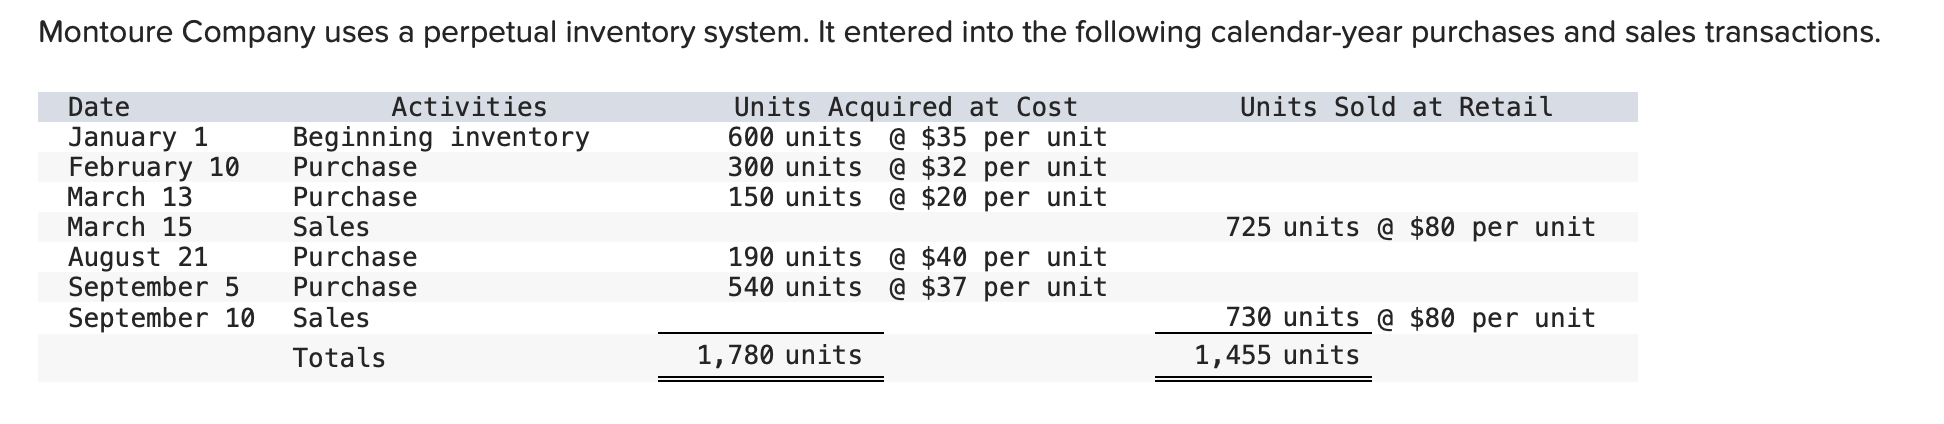
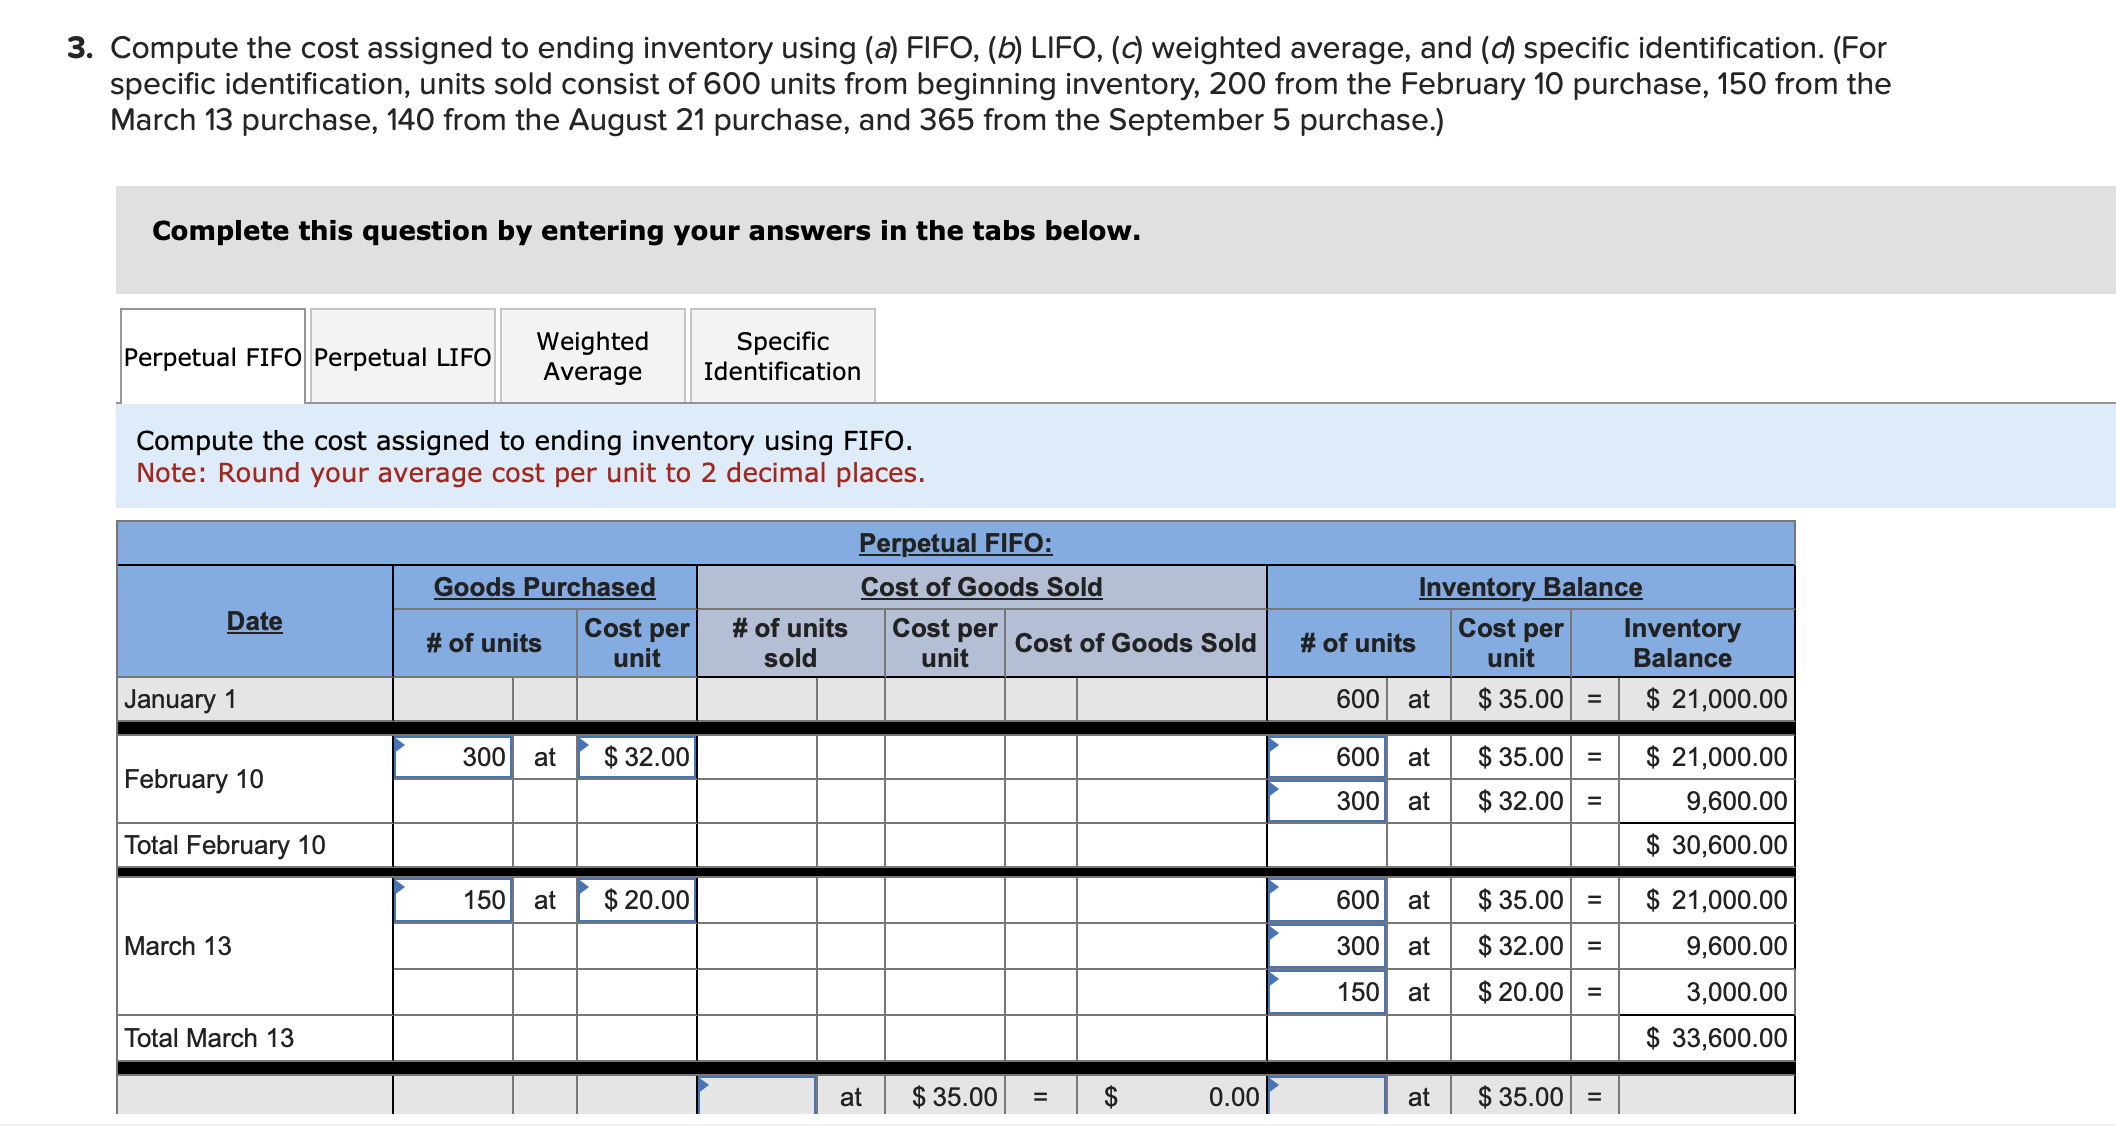
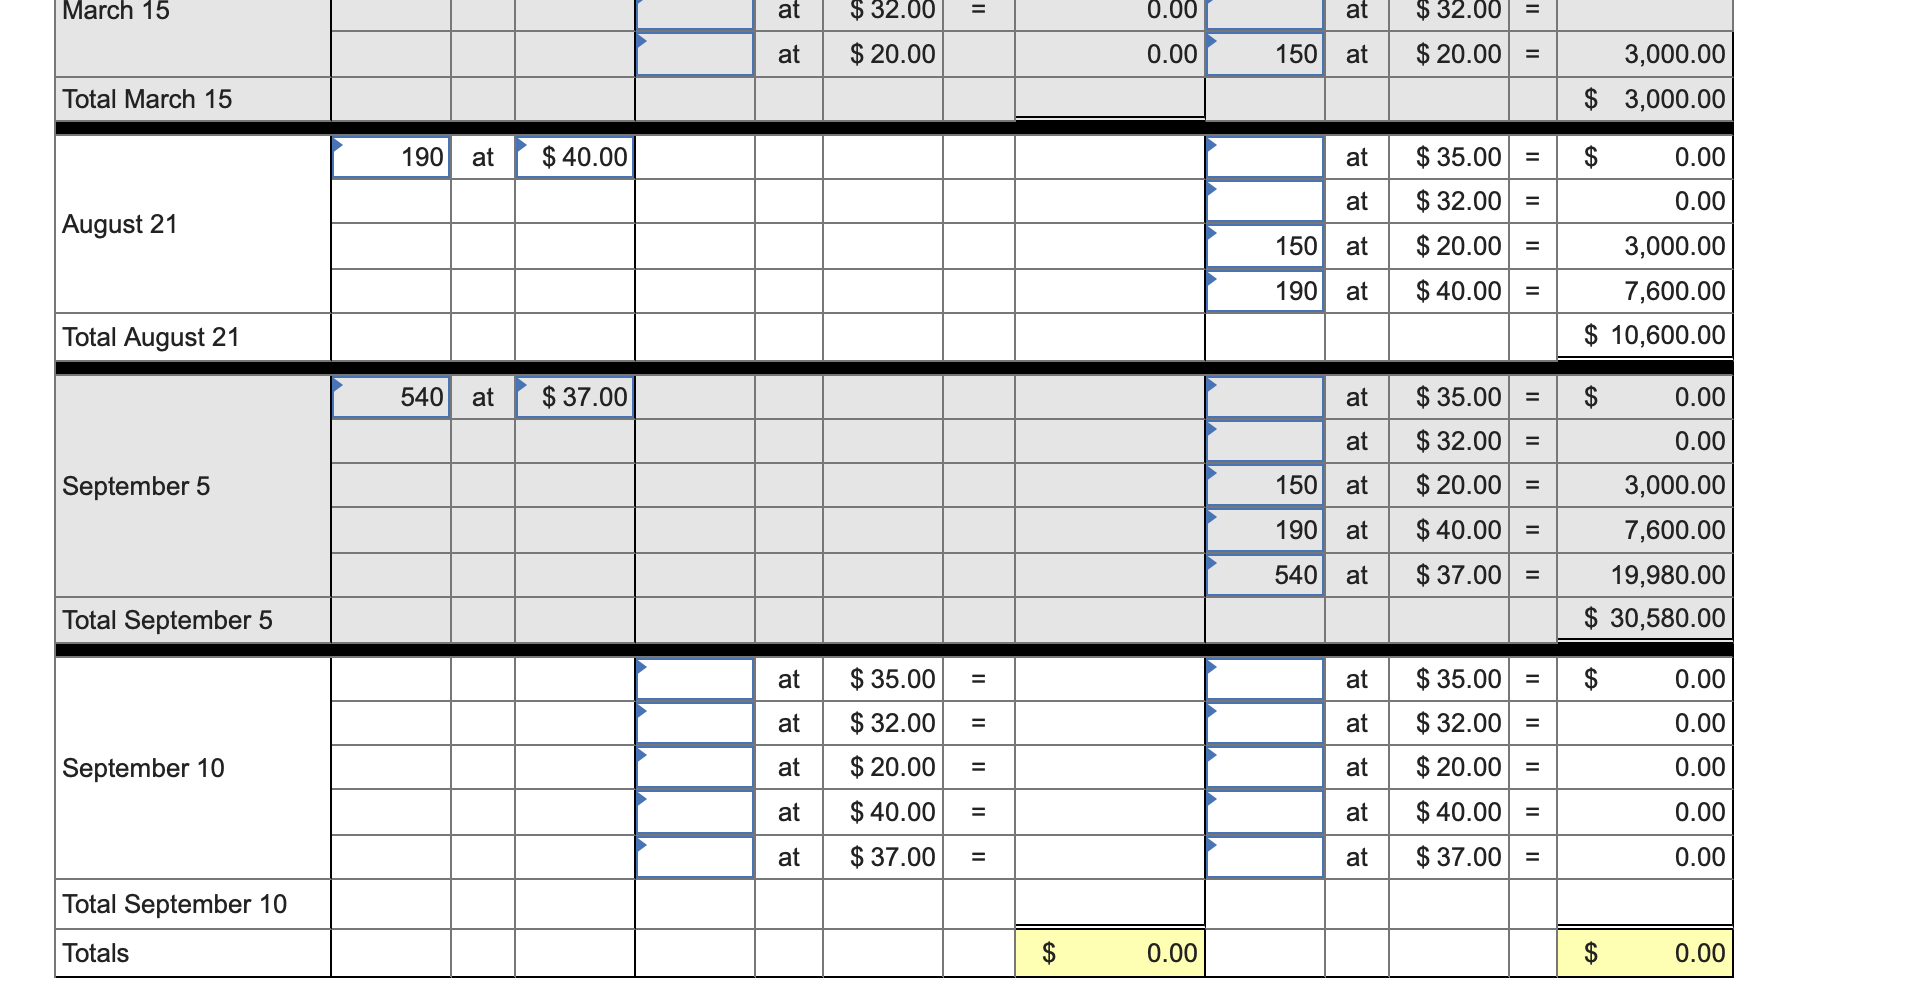
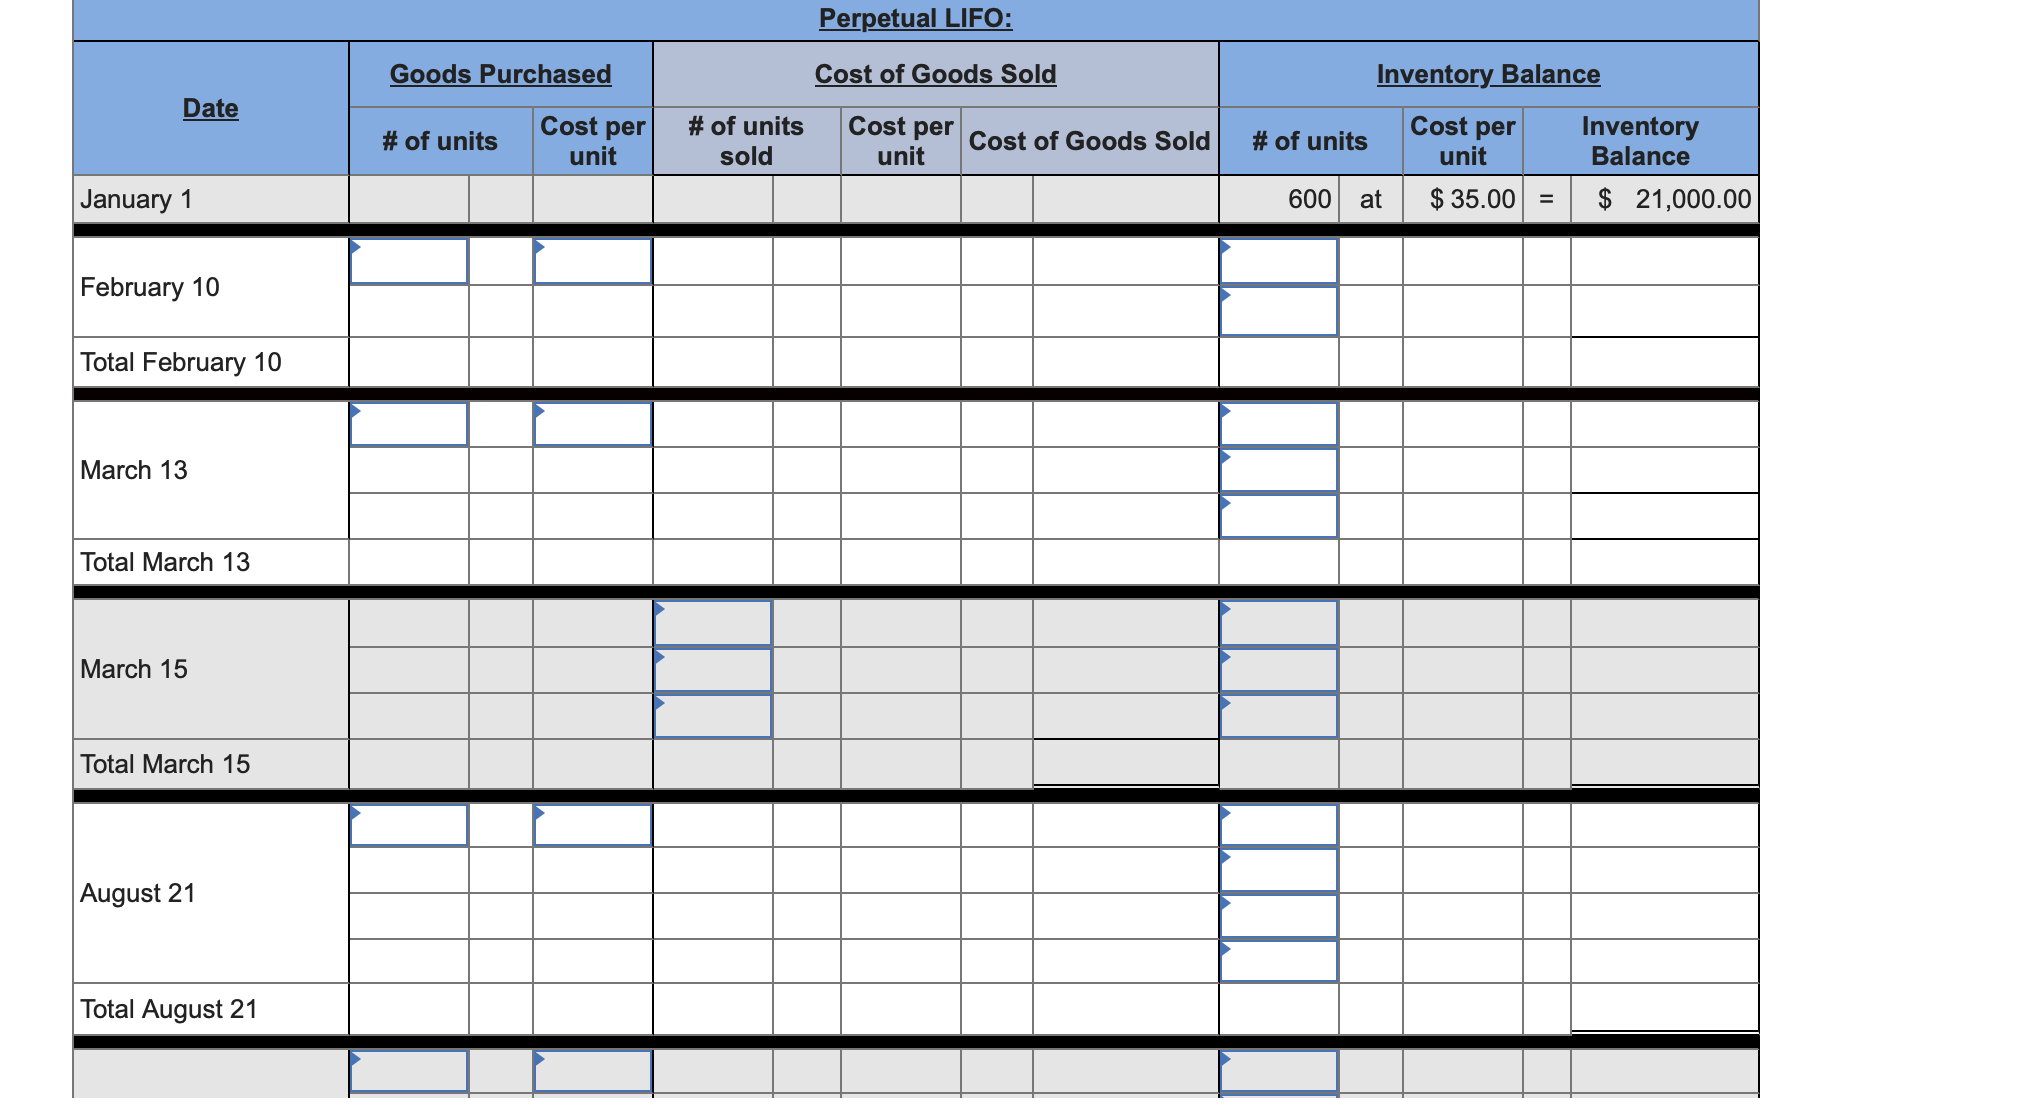
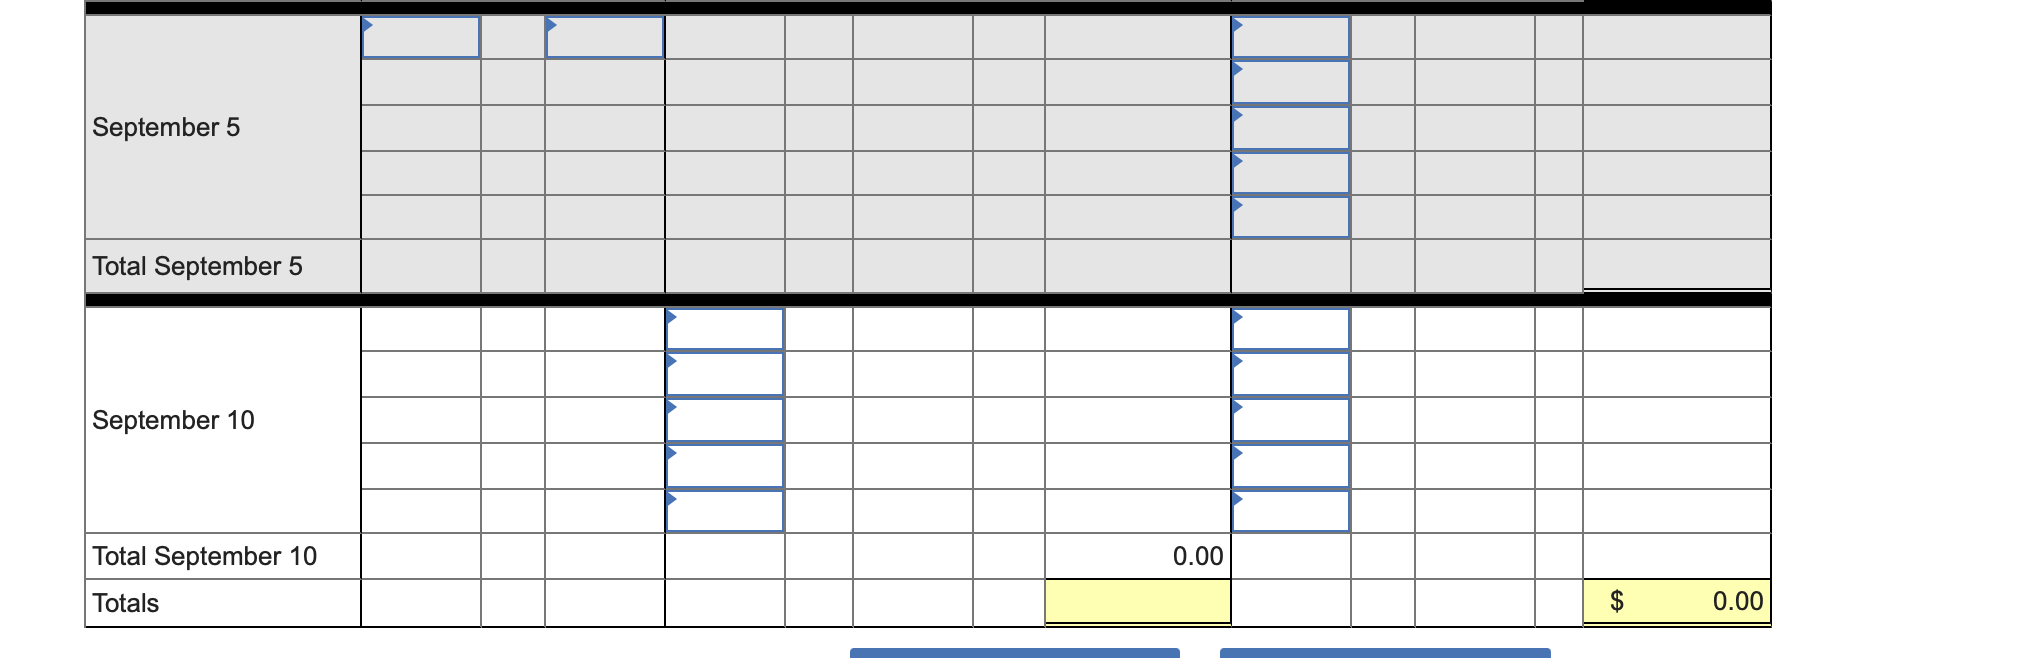
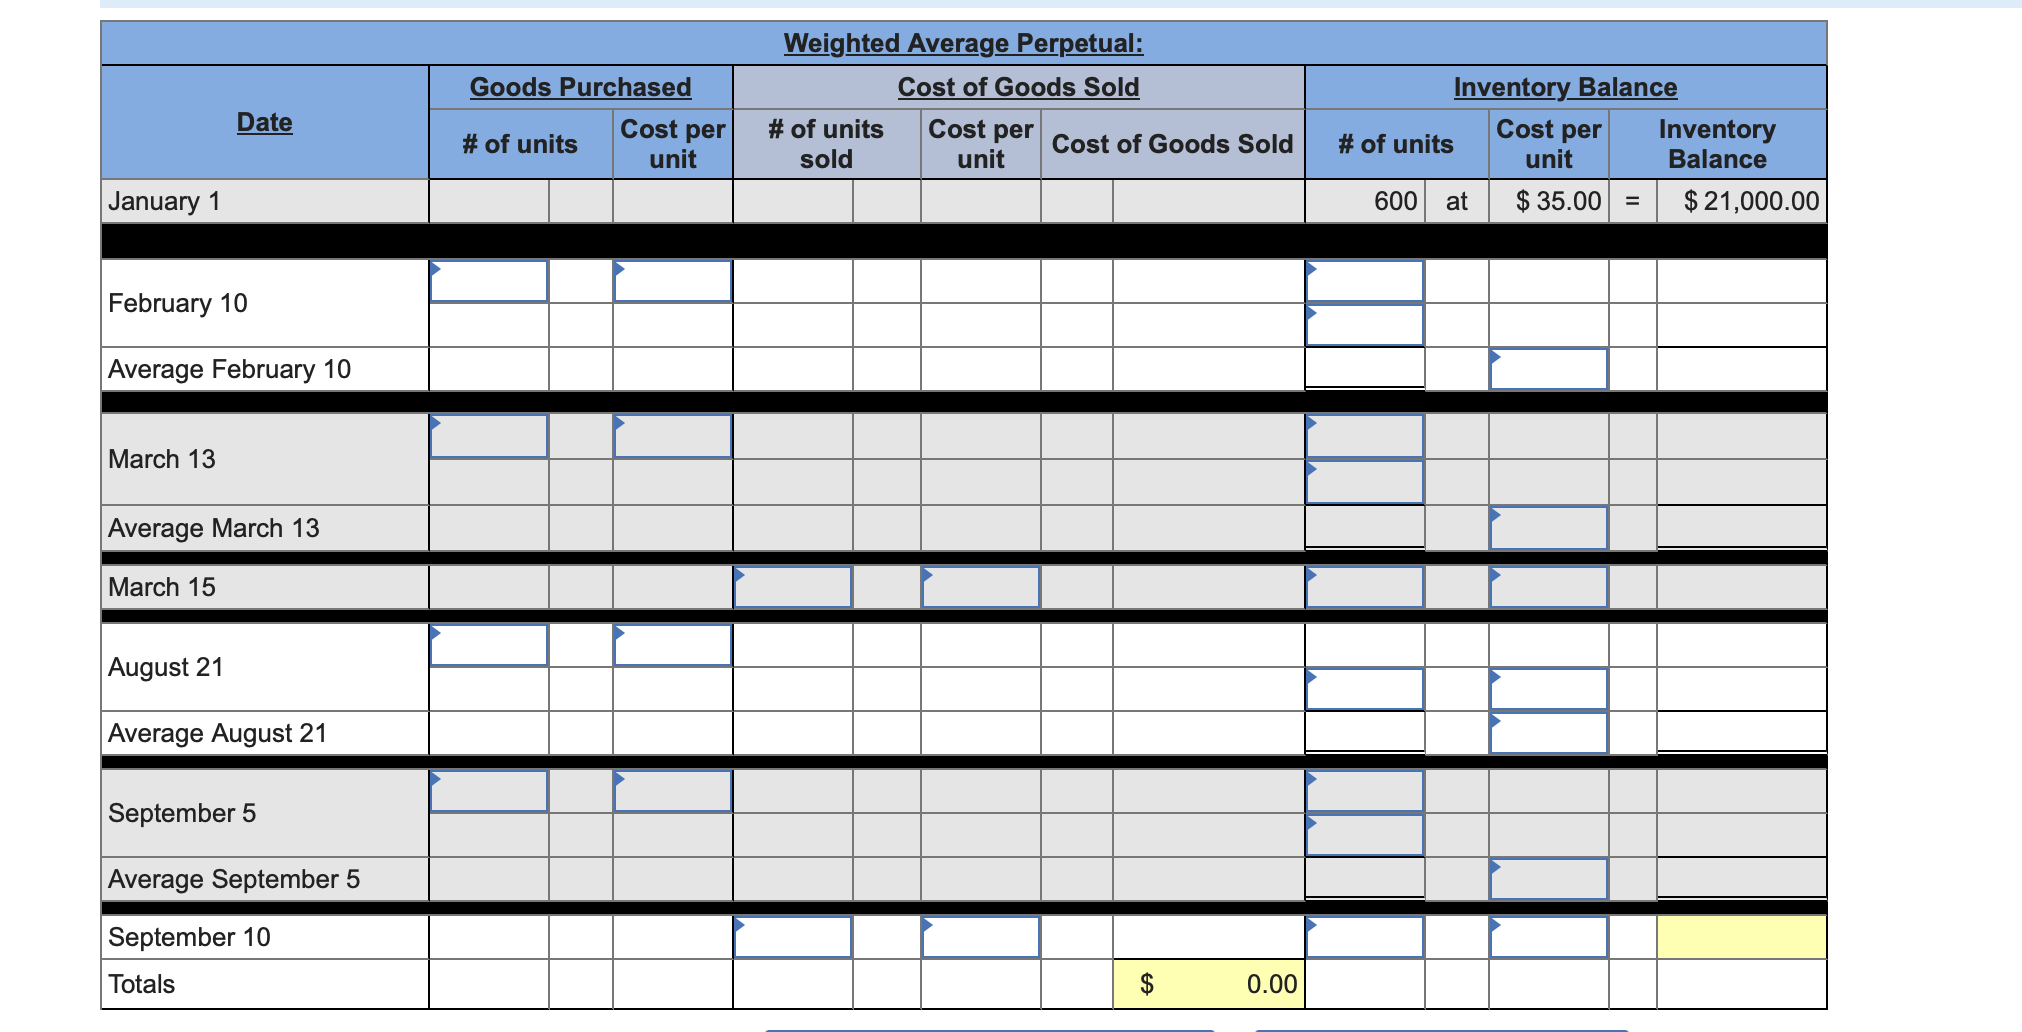
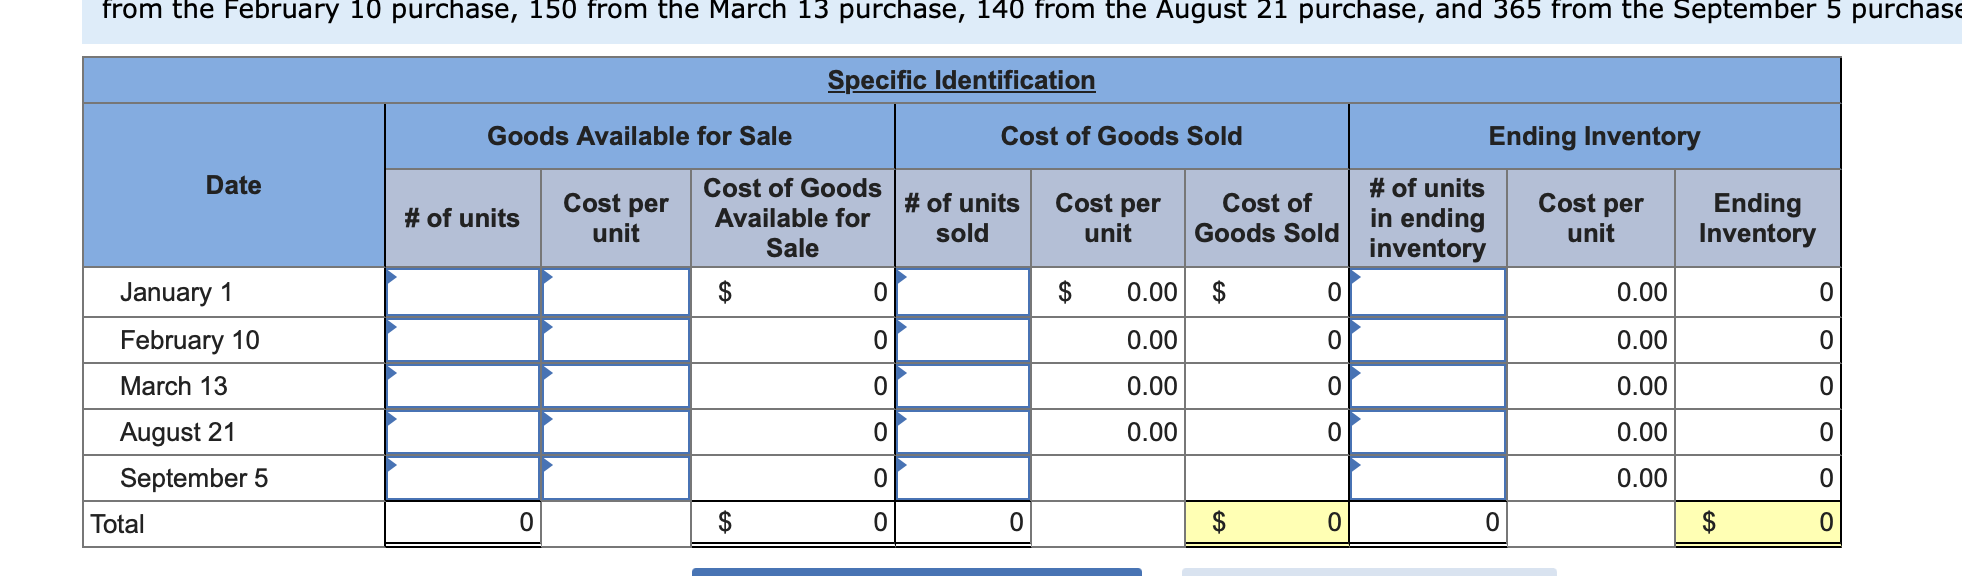
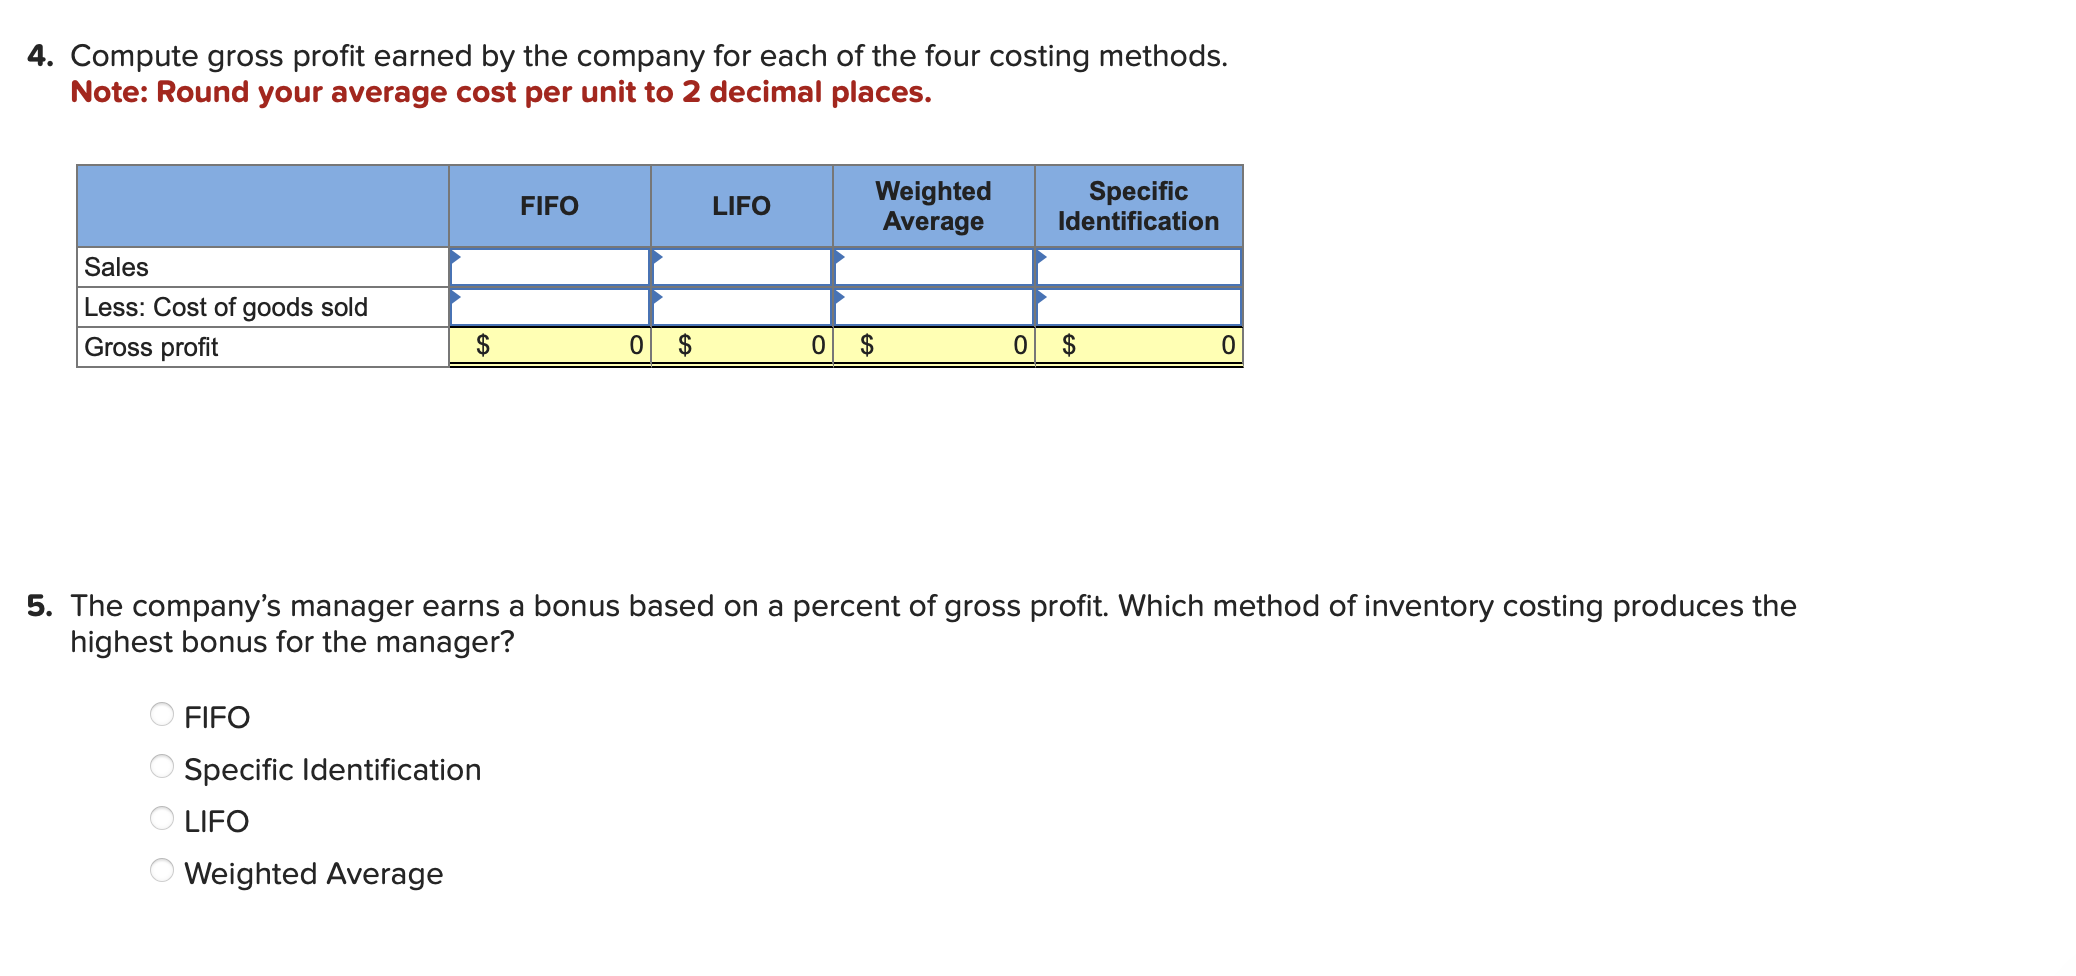
Compute the cost assigned to ending inventory using (a) FIFO, (b) LIFO, (c) weighted average, and ( d ) specific identification. (For specific identification, units sold consist of 600 units from beginning inventory, 200 from the February 10 purchase, 150 from the March 13 purchase, 140 from the August 21 purchase, and 365 from the September 5 purchase.) Complete this question by entering your answers in the tabs below. Compute the cost assigned to ending inventory using FIFO. Note: Round your average cost per unit to 2 decimal places. \begin{tabular}{|c|c|c|c|c|c|c|c|c|c|c|} \hline \multicolumn{11}{|c|}{ Weighted Average Perpetual: } \\ \hline \multirow[b]{2}{*}{ Date } & \multicolumn{2}{|c|}{ Goods Purchased } & \multicolumn{3}{|c|}{ Cost of Goods Sold } & \multicolumn{5}{|c|}{ Inventory Balance } \\ \hline & \# of units & \multirow[t]{2}{*}{Costperunit} & #ofunitssold & \multirow[t]{2}{*}{Costperunit} & Cost of Goods Sold & \multicolumn{2}{|c|}{ \# of units } & \multirow{2}{*}{\begin{tabular}{|c|} Costperunit \\ $35.00 \\ \end{tabular}} & \multicolumn{2}{|c|}{InventoryBalance} \\ \hline January 1 & & & & & & 600 & at & & = & $21,000.00 \\ \hline \multicolumn{11}{|l|}{ February 10} \\ \hline & & & & & & & & & & \\ \hline \multicolumn{11}{|c|}{ Average February 10} \\ \hline \multicolumn{11}{|l|}{ March 13} \\ \hline & & & & & & & & & & \\ \hline \multicolumn{11}{|c|}{ Average March 13} \\ \hline \multicolumn{11}{|l|}{ March 15} \\ \hline \multicolumn{11}{|l|}{ August 21} \\ \hline Rugusit 21 & & & & & & & & & & \\ \hline \multicolumn{11}{|c|}{ Average August 21} \\ \hline \multicolumn{11}{|l|}{ September 5} \\ \hline septemoer s & & & & & & & & & & \\ \hline \multicolumn{11}{|c|}{ Average September 5} \\ \hline \multicolumn{11}{|l|}{ September 10} \\ \hline Totals & & & & & 0.00 & & & & & \\ \hline \end{tabular} Montoure Company uses a perpetual inventory system. It entered into the following calendar-year purchases and sales transactions. \begin{tabular}{|c|c|c|c|c|} \hline Date & Activities & Units Acq & uired at Cost & Units Sold at Retail \\ \hline January 1 & Beginning inventory & 600 units & a \$35 per unit & \\ \hline February 10 & Purchase & 300 units & a $32 per unit & \\ \hline March 13 & Purchase & 150 units & a $20 per unit & \\ \hline March 15 & Sales & & & 725 units @ $80 per unit \\ \hline August 21 & Purchase & 190 units & a $40 per unit & \\ \hline September 5 & Purchase & 540 units & @ $37 per unit & \\ \hline \multirow[t]{2}{*}{ September 10} & Sales & & & 730 units @ $80 per unit \\ \hline & Totals & 1,780 units & & 1,455 units \\ \hline \end{tabular} \begin{tabular}{|l|l|l|l|l|l|l|l|l|l|l|l|} \hline \multirow{5}{*}{ September 5 } & & & & & & & & & & & \\ \end{tabular} from the February 10 purchase, 150 from the March 13 purchase, 140 from the August 21 purchase, and 365 from the September 5 purchase \begin{tabular}{|c|c|c|c|c|c|c|c|c|c|c|} \hline \multicolumn{11}{|c|}{ Specific Identification } \\ \hline \multirow[b]{2}{*}{ Date } & \multicolumn{3}{|c|}{ Goods Available for Sale } & \multicolumn{4}{|c|}{ Cost of Goods Sold } & \multicolumn{3}{|c|}{ Ending Inventory } \\ \hline & \# of units & Costperunit & CostofGoodsAvailableforSale & #ofunitssold & & perit & CostofGoodsSold & #ofunitsinendinginventory & Costperunit & EndingInventory \\ \hline January 1 & & & $ & & $ & 0.00 & $ & & 0.00 & c \\ \hline February 10 & & & 0 & & & 0.00 & 0 & & 0.00 & c \\ \hline March 13 & & & 0 & & & 0.00 & 0 & & 0.00 & c \\ \hline August 21 & & & 0 & & & 0.00 & 0 & & 0.00 & c \\ \hline September 5 & & & 0 & & & & & & 0.00 & c \\ \hline Total & 0 & & $ & 0 & & & $ & 0 & & $ \\ \hline \end{tabular} Perpetual LIFO: \begin{tabular}{|c|c|c|c|c|c|c|c|c|c|c|} \hline \begin{tabular}{|l} Date \\ January 1 \end{tabular} & \multicolumn{2}{|c|}{ Goods Purchased } & \multicolumn{3}{|c|}{ Cost of Goods Sold } & \multicolumn{5}{|c|}{ Inventory Balance } \\ \hline \multirow{2}{*}{\multicolumn{11}{|c|}{ February 10}} \\ \hline & & & & & & & & & & \\ \hline & & & & & & & & & & \\ \hline \multicolumn{11}{|l|}{ March 13} \\ \hline \multicolumn{11}{|l|}{ Total March 13} \\ \hline \multicolumn{11}{|l|}{ Total March 15} \\ \hline & & & & & & & & & & \\ \hline \multirow{2}{*}{\multicolumn{11}{|c|}{ August 21}} \\ \hline & & & & & & & & & & \\ \hline \multicolumn{11}{|l|}{ Total August 21} \\ \hline & & & & & & & & & & \\ \hline \end{tabular} 4. Compute gross profit earned by the company for each of the four costing methods. Note: Round your average cost per unit to 2 decimal places. 5. The company's manager earns a bonus based on a percent of gross profit. Which method of inventory costing produces the highest bonus for the manager? FIFO Specific Identification LIFO Weighted Average
Step by Step Solution
There are 3 Steps involved in it

Get step-by-step solutions from verified subject matter experts