

Question: Compute the first quartile (Q1), the third quartile (Q3), and the interquartile range: Q1: Q3: interquartile range: percentage of acountry's population that uses a certain
Compute the first quartile (Q1), the third quartile (Q3), and the interquartile range:
Q1:
Q3:
interquartile range:
percentage of acountry's population that uses a certain social media.
57 58 43 56 42 34 6 24 43 17 42
5 32 28 60 20 26 37 44 79 57 55
b.List thefive-number summary. (dont round)
C + D:
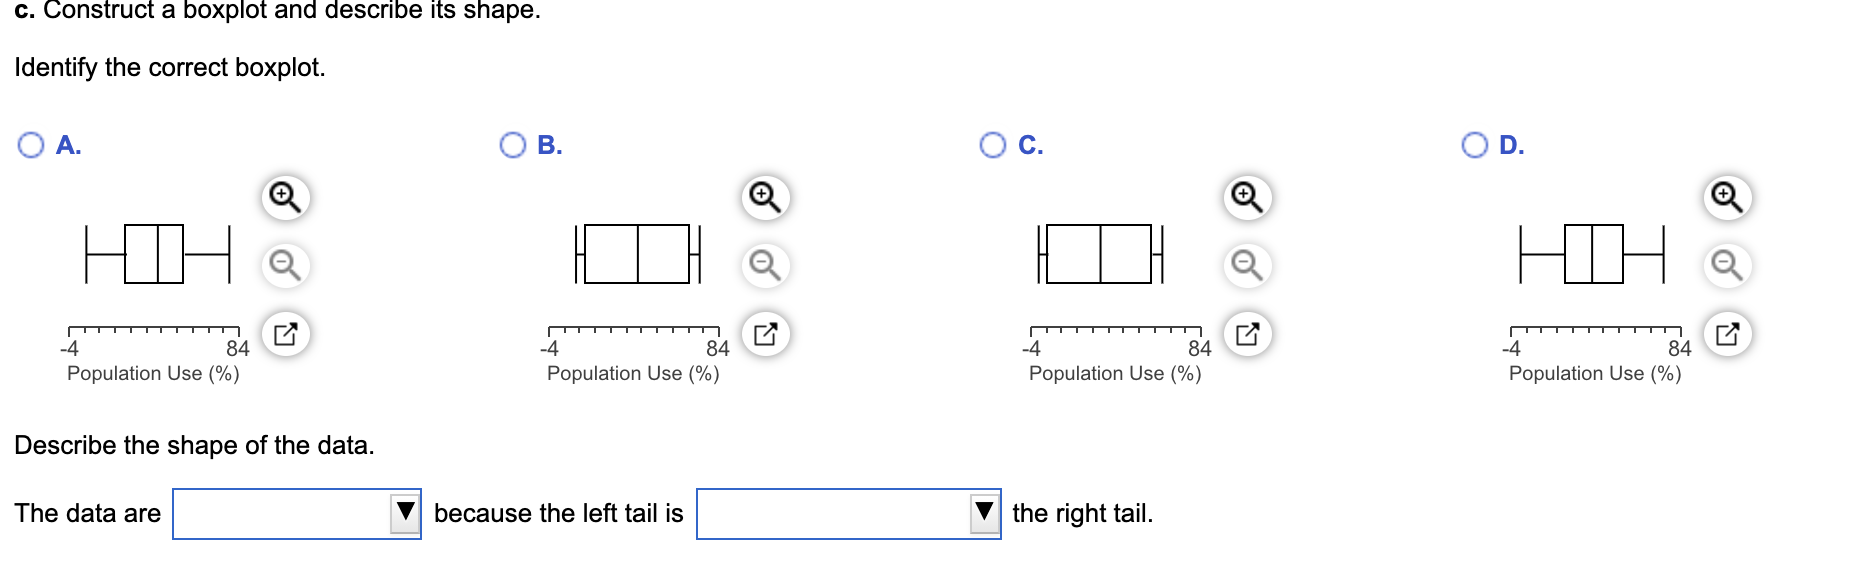
c. Construct a boxplot and describe its shape. Identify the correct boxplot. O A. O B. O c. OD. + H HII 4 84 4 84 4 84 4 84 Population Use (%) Population Use (%) Population Use (%) Population Use (%) Describe the shape of the data. The data are because the left tail is the right tail
Step by Step Solution
There are 3 Steps involved in it
1 Expert Approved Answer
Step: 1 Unlock

Question Has Been Solved by an Expert!
Get step-by-step solutions from verified subject matter experts
Step: 2 Unlock
Step: 3 Unlock