

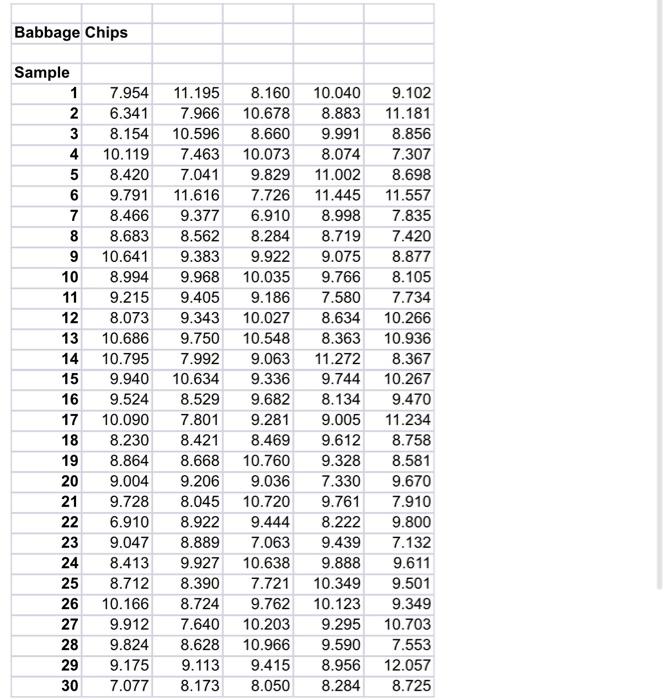
Question: Compute the mean, standard deviation and other descriptive statistics for the data, including a histogram as well. (10 points) Calculate the control limits and construct
- Compute the mean, standard deviation and other descriptive statistics for the data, including a histogram as well. (10 points)
- Calculate the control limits and construct the x-bar and R-charts for these 30 samples. Is the process under control? (15 points)
- Specifications for the process are 9.2 3.2 ohms. If the process is under control, calculate the capability indexes, Cpu, Cpl, Cp, and Cpk using the part of the and R-charts Excel template that calculates the process capability. What do the indexes indicate? (10 points)
Step by Step Solution
There are 3 Steps involved in it
1 Expert Approved Answer
Step: 1 Unlock

Question Has Been Solved by an Expert!
Get step-by-step solutions from verified subject matter experts
Step: 2 Unlock
Step: 3 Unlock