

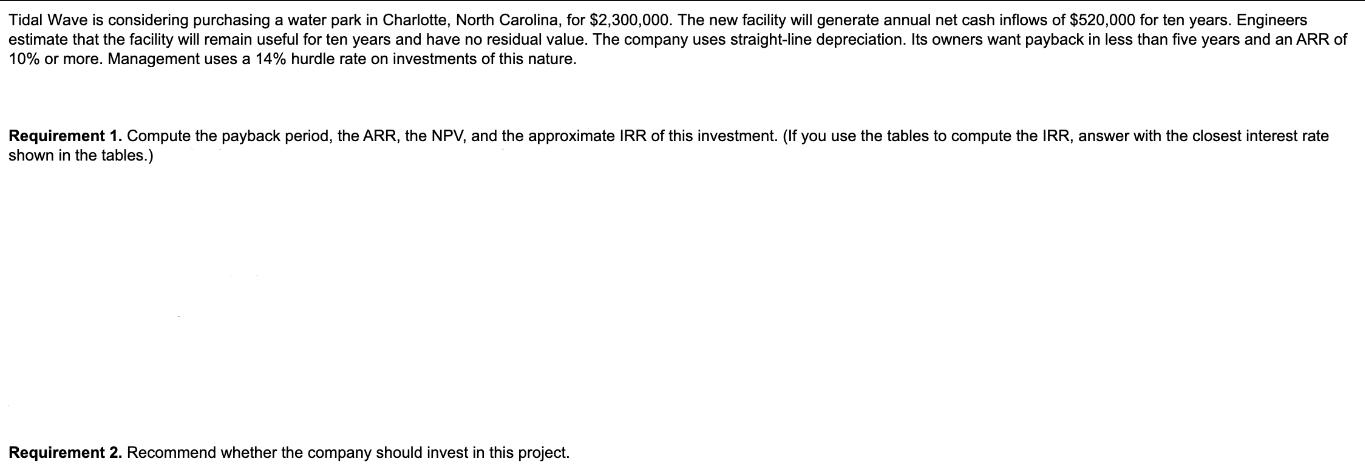
Compute the payback period, the ARR, the NPV, and the approximate IRR of this investment. (If...
Fantastic news! We've Found the answer you've been seeking!
Question:

Transcribed Image Text:
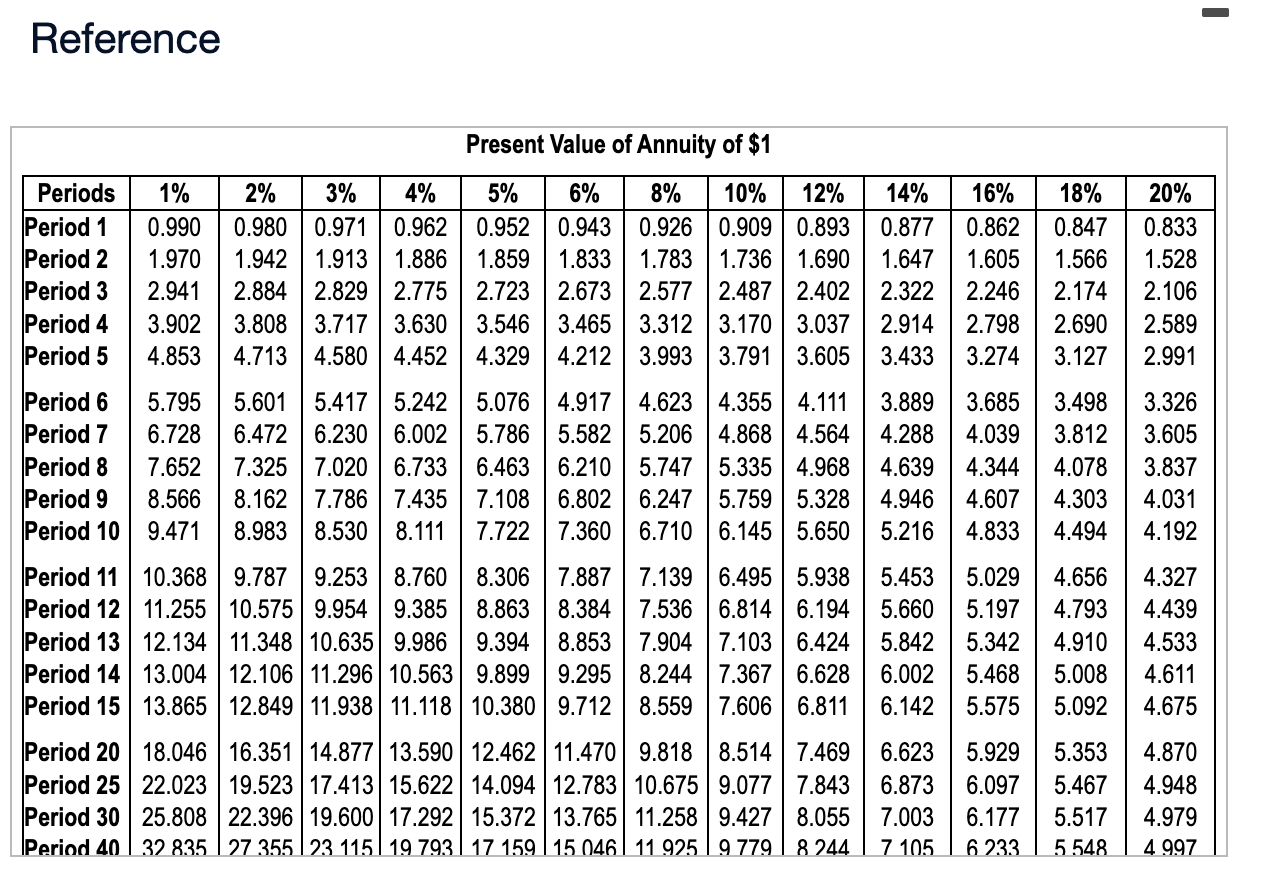
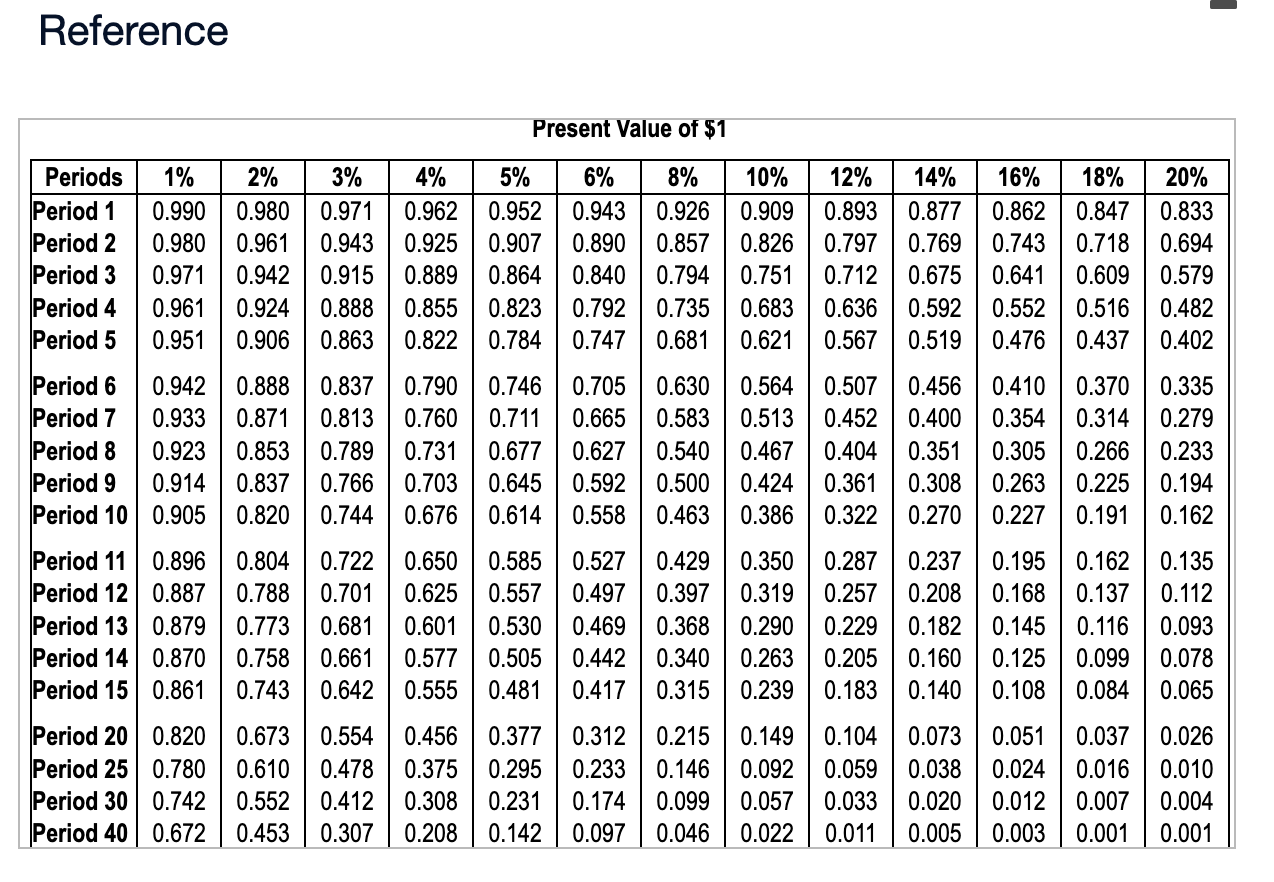
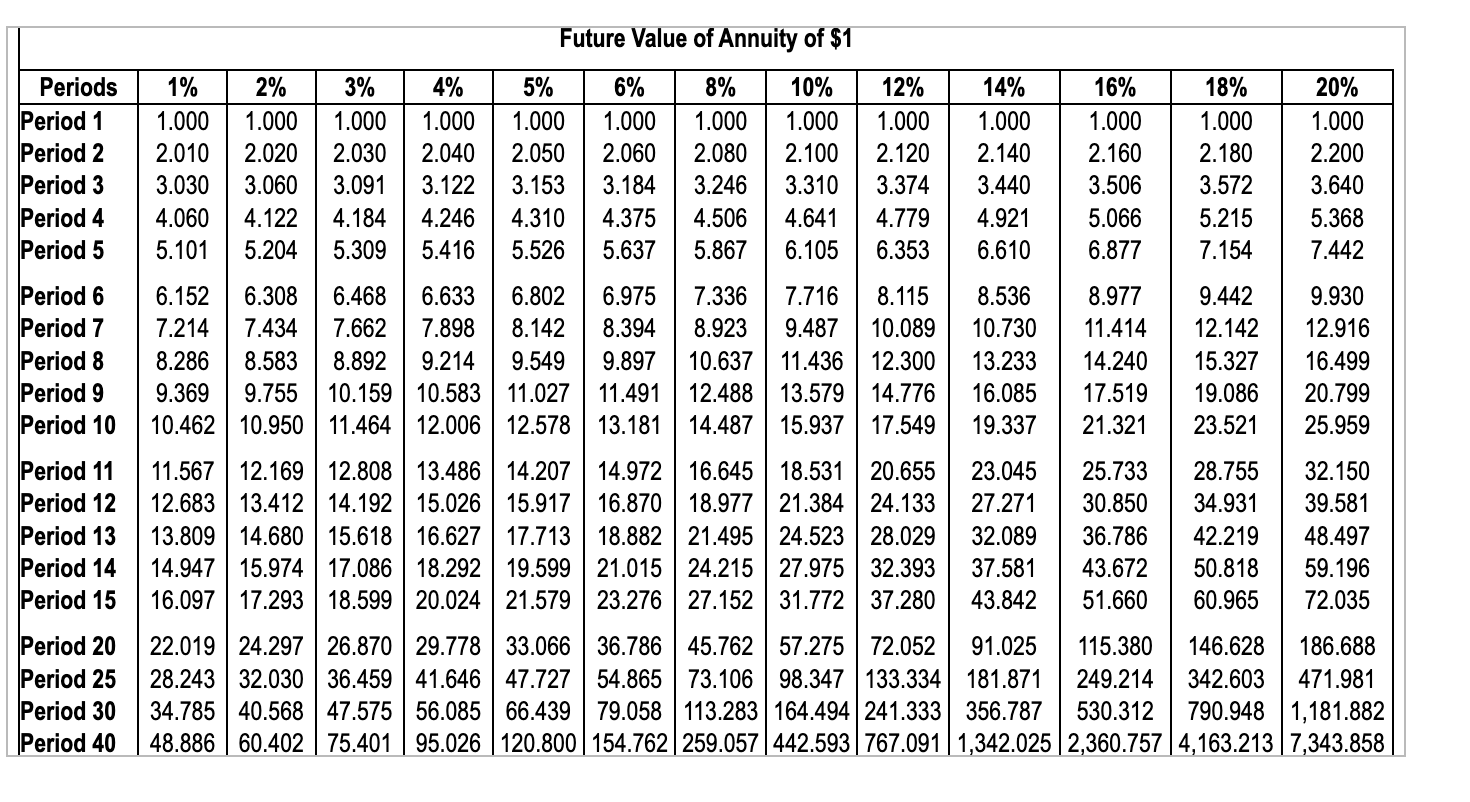
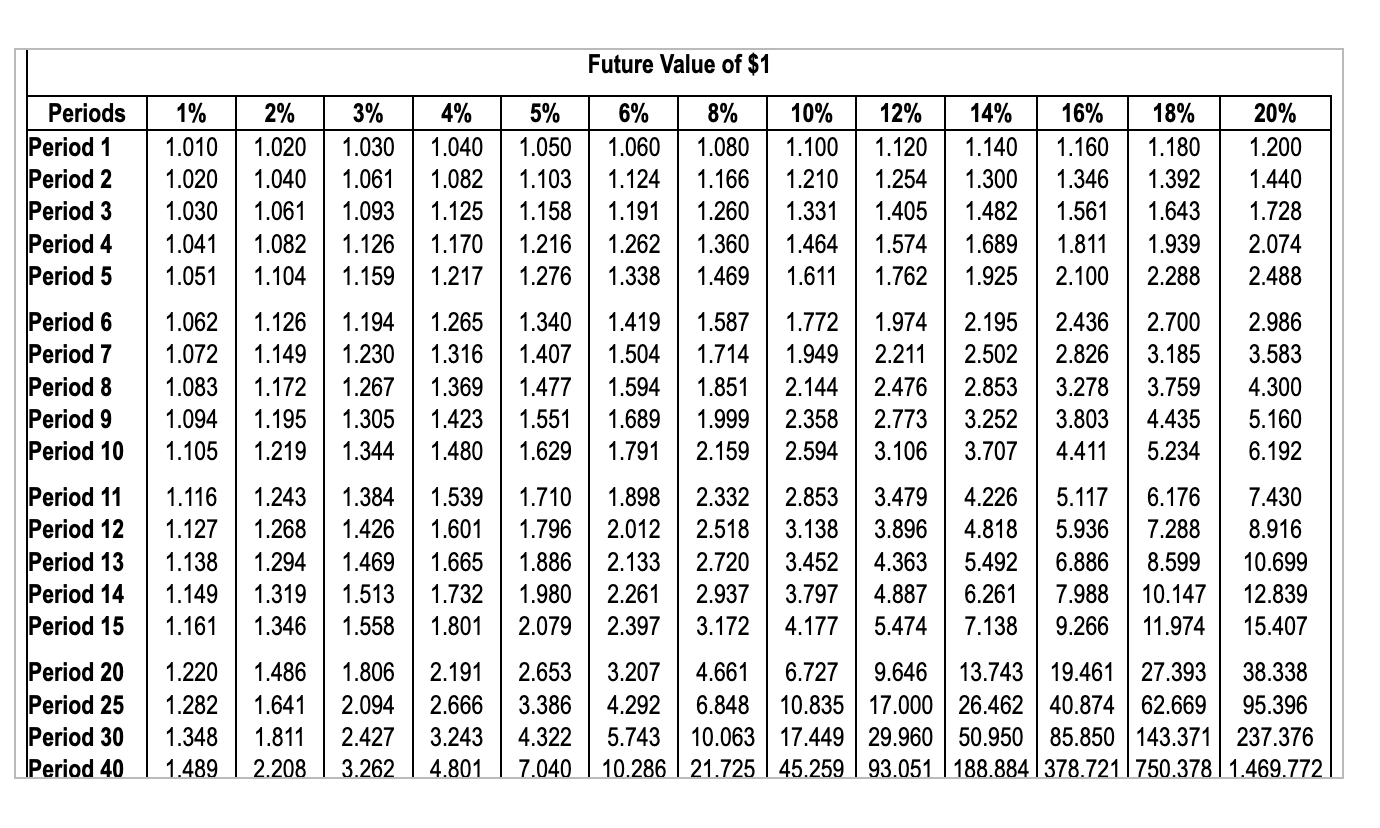
Compute the payback period, the ARR, the NPV, and the approximate IRR of this investment. (If you use the tables to compute the IRR, answer with the closest interest rate shown in the tables.) Recommend whether the company should invest in this project. Reference Present Value of Annuity of $1 Periods Period 1 1% 0.990 Period 2 1.970 Period 3 2.941 Period 4 3.902 Period 5 4.853 Period 6 5.795 Period 7 6.728 Period 8 7.652 Period 9 8.566 Period 10 9.471 Period 14 13.004 9.394 8.853 7.904 7.103 6.424 12.106 11.296 10.563 9.899 9.295 8.244 7.367 6.628 2% 3% 4% 5% 6% 8% 10% 12% 14% 16% 18% 20% 0.980 0.971 0.962 0.952 0.943 0.926 0.909 0.893 0.877 0.862 0.847 0.833 1.942 1.913 1.886 1.859 1.833 1.783 1.736 1.690 1.647 1.605 1.566 1.528 2.884 2.829 2.775 2.723 2.673 2.577 2.487 2.402 3.808 3.717 3.630 3.546 3.465 3.312 3.170 3.037 4.713 4.580 4.452 4.329 4.212 3.993 3.791 3.605 5.601 5.417 5.242 6.472 6.230 6.002 7.325 7.020 6.733 8.162 7.786 7.435 8.983 8.530 8.111 Period 11 10.368 9.787 9.253 8.760 Period 12 11.255 10.575 9.954 9.385 Period 13 12.134 11.348 10.635 9.986 2.322 2.246 2.914 2.798 3.433 3.274 3.127 2.174 2.106 2.690 2.589 2.991 5.076 4.917 4.623 4.355 5.786 5.582 5.206 4.868 4.564 6.463 6.210 5.747 5.335 4.968 7.108 6.802 6.247 5.759 5.328 7.722 7.360 6.710 6.145 5.650 4.111 3.889 3.685 3.498 3.326 4.288 4.039 3.812 3.605 4.639 4.344 4.078 3.837 4.946 4.607 4.303 4.031 5.216 4.833 4.494 4.192 8.306 7.887 7.139 6.495 5.938 8.863 8.384 7.536 6.814 6.194 5.453 5.029 4.656 4.327 5.660 5.197 4.793 4.439 5.842 5.342 4.910 4.533 6.002 5.468 5.008 4.611 Period 15 13.865 12.849 11.938 11.118 10.380 9.712 8.559 7.606 6.811 6.142 5.575 5.092 4.675 Period 20 18.046 16.351 14.877 13.590 12.462 11.470 9.818 8.514 Period 25 22.023 19.523 17.413 15.622 14.094 12.783 10.675 9.077 Period 30 25.808 22.396 19.600 17.292 15.372 13.765 11.258 9.427 Period 40 32 835 27 355 23 115 19 793 17 159 15 046 11 925 9779 7.469 6.623 7.843 5.929 5.353 4.870 6.873 6.097 5.467 4.948 8.055 8 244 7.003 7 105 6.177 5.517 4.979 6233 5.548 4.997 Reference Present Value of $1 Periods 1% 2% 3% 4% 5% Period 1 0.990 0.980 0.971 0.962 0.952 0.943 Period 2 0.980 0.961 0.943 0.925 0.907 0.890 Period 3 0.971 0.942 0.915 0.889 0.864 Period 4 0.961 0.924 0.888 0.855 0.823 Period 5 0.951 0.906 0.863 0.822 0.784 6% 8% 10% 12% 14% 16% 18% 20% 0.926 0.909 0.893 0.877 0.862 0.847 0.833 0.857 0.826 0.797 0.769 0.743 0.718 0.840 0.794 0.751 0.712 0.675 0.641 0.609 0.792 0.735 0.683 0.636 0.592 0.552 0.516 0.482 0.747 0.681 0.621 0.567 0.519 0.476 0.437 0.402 0.694 0.579 Period 6 0.942 0.888 Period 7 0.933 0.871 Period 8 0.923 Period 9 0.914 Period 10 0.905 0.837 0.790 0.813 0.760 0.853 0.789 0.731 0.837 0.766 0.677 0.627 0.540 0.467 0.746 0.705 0.630 0.564 0.507 0.456 0.410 0.370 0.335 0.711 0.665 0.583 0.513 0.452 0.400 0.354 0.314 0.279 0.266 0.233 0.404 0.351 0.305 0.703 0.645 0.592 0.500 0.424 0.361 0.308 0.263 0.225 0.194 0.820 0.744 0.676 0.614 0.558 0.463 0.386 0.322 0.270 0.227 0.191 0.162 Period 11 0.896 Period 12 0.887 Period 13 0.879 0.773 Period 14 0.870 0.758 0.804 0.722 0.788 0.701 0.681 0.661 0.577 0.650 0.625 0.557 0.601 0.530 0.585 0.527 0.429 0.350 0.287 0.237 0.195 0.162 0.135 0.497 0.397 0.319 0.257 0.469 0.368 0.290 0.229 0.505 0.442 0.340 0.263 0.205 Period 15 0.861 0.743 0.642 0.555 0.481 0.417 0.315 0.239 0.183 0.208 0.168 0.137 0.112 0.182 0.145 0.116 0.093 0.160 0.125 0.099 0.078 0.140 0.108 0.084 0.065 Period 20 0.820 0.673 0.554 0.456 0.377 0.312 0.215 0.149 0.104 Period 25 0.780 0.610 Period 30 0.742 0.552 Period 40 0.672 0.453 0.478 0.375 0.295 0.233 0.146 0.092 0.059 0.073 0.051 0.037 0.026 0.038 0.024 0.016 0.010 0.412 0.308 0.231 0.174 0.099 0.057 0.033 0.020 0.012 0.007 0.004 0.307 0.208 0.142 0.097 0.046 0.022 0.011 0.005 0.003 0.001 0.001 Future Value of Annuity of $1 Periods 1% 2% 3% 4% 5% Period 1 1.000 1.000 1.000 1.000 1.000 6% 8% 10% 1.000 1.000 1.000 12% 14% 16% 18% 20% 1.000 1.000 1.000 1.000 1.000 Period 2 2.010 2.020 2.030 2.040 2.050 2.060 2.080 2.100 2.120 2.140 2.160 2.180 2.200 Period 3 3.030 3.060 3.091 3.122 3.153 3.184 3.246 3.310 3.374 3.440 3.506 3.572 3.640 Period 4 4.060 4.122 4.184 4.246 4.310 4.375 4.506 4.641 4.779 4.921 5.066 5.215 5.368 Period 5 5.101 5.204 5.309 5.416 5.526 5.637 5.867 6.105 6.353 6.610 6.877 7.154 7.442 Period 6 6.152 6.308 6.468 6.633 6.802 6.975 7.336 7.716 8.115 8.536 8.977 9.442 9.930 Period 7 7.214 7.434 7.662 7.898 8.142 8.394 8.923 9.487 10.089 10.730 11.414 12.142 12.916 Period 8 Period 9 9.369 8.286 8.583 8.892 9.214 9.549 9.897 10.637 11.436 12.300 13.233 14.240 15.327 16.499 9.755 10.159 10.583 11.027 11.491 12.488 13.579 14.776 16.085 17.519 19.086 20.799 Period 10 10.462 10.950 11.464 12.006 12.578 13.181 14.487 15.937 17.549 19.337 21.321 23.521 25.959 Period 11 11.567 12.169 12.808 13.486 14.207 14.972 16.645 18.531 20.655 Period 12 12.683 13.412 14.192 15.026 15.917 16.870 18.977 21.384 24.133 Period 13 13.809 14.680 15.618 16.627 17.713 18.882 21.495 24.523 28.029 Period 14 14.947 15.974 17.086 18.292 19.599 21.015 24.215 27.975 32.393 Period 15 16.097 17.293 18.599 20.024 21.579 Period 20 23.045 25.733 28.755 32.150 27.271 32.089 36.786 42.219 30.850 34.931 39.581 48.497 37.581 43.672 50.818 59.196 23.276 27.152 31.772 37.280 43.842 51.660 60.965 72.035 Period 25 Period 30 Period 40 22.019 24.297 26.870 29.778 33.066 36.786 45.762 57.275 72.052 28.243 32.030 36.459 41.646 47.727 54.865 73.106 98.347 133.334 34.785 40.568 47.575 56.085 66.439 79.058 113.283 164.494 241.333 356.787 530.312 790.948 1,181.882 48.886 60.402 75.401 95.026 120.800 154.762 259.057 442.593 767.091 1,342.025 2,360.757 4,163.213 7,343.858 91.025 115.380 146.628 186.688 181.871 249.214 342.603 471.981 Future Value of $1 Periods 1% 2% 3% 4% 5% Period 1 1.010 1.020 1.030 1.040 1.050 6% 8% 1.060 1.080 Period 2 1.020 1.040 1.061 1.082 1.103 Period 3 1.030 1.061 1.093 1.125 1.158 Period 4 1.041 1.082 1.126 1.170 1.216 Period 5 1.051 1.104 1.159 1.217 1.276 1.124 1.166 1.191 1.260 1.262 1.360 1.464 1.338 1.469 1.611 10% 12% 14% 16% 1.100 1.120 1.140 1.210 1.254 1.300 1.331 1.405 1.482 1.561 1.574 1.689 1.811 1.939 2.074 18% 20% 1.160 1.180 1.200 1.346 1.392 1.440 1.643 1.728 1.762 1.925 2.100 2.288 2.488 Period 6 1.062 1.126 1.194 1.265 1.340 1.419 1.587 1.772 1.974 2.195 2.436 2.700 2.986 Period 7 1.072 1.149 1.230 1.316 1.407 1.504 1.714 1.949 2.211 2.502 2.826 3.185 3.583 Period 8 1.083 1.172 1.267 1.369 1.477 1.594 1.851 2.144 2.476 2.853 3.278 3.759 4.300 Period 9 1.094 1.195 1.305 1.423 1.551 1.689 1.999 2.358 2.773 3.252 3.803 4.435 5.160 Period 10 1.105 1.219 1.344 1.480 1.629 1.791 2.159 2.594 3.106 3.707 4.411 5.234 6.192 Period 11 1.116 1.243 1.384 1.539 1.710 1.898 2.332 2.853 3.479 4.226 5.117 6.176 7.430 Period 12 1.127 1.268 1.426 1.601 1.796 2.012 2.518 3.138 3.896 4.818 5.936 7.288 8.916 Period 13 Period 14 Period 15 1.161 Period 20 Period 25 1.282 Period 30 1.348 Period 40 1.489 1.138 1.294 1.469 1.665 1.886 2.133 2.720 3.452 4.363 5.492 6.886 8.599 10.699 1.149 1.319 1.513 1.732 1.980 2.261 2.937 3.797 4.887 6.261 7.988 10.147 12.839 1.346 1.558 1.801 2.079 2.397 3.172 4.177 5.474 7.138 9.266 11.974 15.407 1.220 1.486 1.806 2.191 2.653 3.207 4.661 6.727 9.646 1.641 2.094 2.666 3.386 1.811 2.427 2.208 3.262 3.243 4.322 4.801 7.040 13.743 19.461 27.393 38.338 4.292 6.848 10.835 17.000 26.462 40.874 62.669 95.396 5.743 10.063 17.449 29.960 50.950 85.850 143.371 237.376 10.286 21.725 45.259 93.051 188.884 378.721 750.378 1.469.772 Tidal Wave is considering purchasing a water park in Charlotte, North Carolina, for $2,300,000. The new facility will generate annual net cash inflows of $520,000 for ten years. Engineers estimate that the facility will remain useful for ten years and have no residual value. The company uses straight-line depreciation. Its owners want payback in less than five years and an ARR of 10% or more. Management uses a 14% hurdle rate on investments of this nature. Requirement 1. Compute the payback period, the ARR, the NPV, and the approximate IRR of this investment. (If you use the tables to compute the IRR, answer with the closest interest rate shown in the tables.) Requirement 2. Recommend whether the company should invest in this project. Compute the payback period, the ARR, the NPV, and the approximate IRR of this investment. (If you use the tables to compute the IRR, answer with the closest interest rate shown in the tables.) Recommend whether the company should invest in this project. Reference Present Value of Annuity of $1 Periods Period 1 1% 0.990 Period 2 1.970 Period 3 2.941 Period 4 3.902 Period 5 4.853 Period 6 5.795 Period 7 6.728 Period 8 7.652 Period 9 8.566 Period 10 9.471 Period 14 13.004 9.394 8.853 7.904 7.103 6.424 12.106 11.296 10.563 9.899 9.295 8.244 7.367 6.628 2% 3% 4% 5% 6% 8% 10% 12% 14% 16% 18% 20% 0.980 0.971 0.962 0.952 0.943 0.926 0.909 0.893 0.877 0.862 0.847 0.833 1.942 1.913 1.886 1.859 1.833 1.783 1.736 1.690 1.647 1.605 1.566 1.528 2.884 2.829 2.775 2.723 2.673 2.577 2.487 2.402 3.808 3.717 3.630 3.546 3.465 3.312 3.170 3.037 4.713 4.580 4.452 4.329 4.212 3.993 3.791 3.605 5.601 5.417 5.242 6.472 6.230 6.002 7.325 7.020 6.733 8.162 7.786 7.435 8.983 8.530 8.111 Period 11 10.368 9.787 9.253 8.760 Period 12 11.255 10.575 9.954 9.385 Period 13 12.134 11.348 10.635 9.986 2.322 2.246 2.914 2.798 3.433 3.274 3.127 2.174 2.106 2.690 2.589 2.991 5.076 4.917 4.623 4.355 5.786 5.582 5.206 4.868 4.564 6.463 6.210 5.747 5.335 4.968 7.108 6.802 6.247 5.759 5.328 7.722 7.360 6.710 6.145 5.650 4.111 3.889 3.685 3.498 3.326 4.288 4.039 3.812 3.605 4.639 4.344 4.078 3.837 4.946 4.607 4.303 4.031 5.216 4.833 4.494 4.192 8.306 7.887 7.139 6.495 5.938 8.863 8.384 7.536 6.814 6.194 5.453 5.029 4.656 4.327 5.660 5.197 4.793 4.439 5.842 5.342 4.910 4.533 6.002 5.468 5.008 4.611 Period 15 13.865 12.849 11.938 11.118 10.380 9.712 8.559 7.606 6.811 6.142 5.575 5.092 4.675 Period 20 18.046 16.351 14.877 13.590 12.462 11.470 9.818 8.514 Period 25 22.023 19.523 17.413 15.622 14.094 12.783 10.675 9.077 Period 30 25.808 22.396 19.600 17.292 15.372 13.765 11.258 9.427 Period 40 32 835 27 355 23 115 19 793 17 159 15 046 11 925 9779 7.469 6.623 7.843 5.929 5.353 4.870 6.873 6.097 5.467 4.948 8.055 8 244 7.003 7 105 6.177 5.517 4.979 6233 5.548 4.997 Reference Present Value of $1 Periods 1% 2% 3% 4% 5% Period 1 0.990 0.980 0.971 0.962 0.952 0.943 Period 2 0.980 0.961 0.943 0.925 0.907 0.890 Period 3 0.971 0.942 0.915 0.889 0.864 Period 4 0.961 0.924 0.888 0.855 0.823 Period 5 0.951 0.906 0.863 0.822 0.784 6% 8% 10% 12% 14% 16% 18% 20% 0.926 0.909 0.893 0.877 0.862 0.847 0.833 0.857 0.826 0.797 0.769 0.743 0.718 0.840 0.794 0.751 0.712 0.675 0.641 0.609 0.792 0.735 0.683 0.636 0.592 0.552 0.516 0.482 0.747 0.681 0.621 0.567 0.519 0.476 0.437 0.402 0.694 0.579 Period 6 0.942 0.888 Period 7 0.933 0.871 Period 8 0.923 Period 9 0.914 Period 10 0.905 0.837 0.790 0.813 0.760 0.853 0.789 0.731 0.837 0.766 0.677 0.627 0.540 0.467 0.746 0.705 0.630 0.564 0.507 0.456 0.410 0.370 0.335 0.711 0.665 0.583 0.513 0.452 0.400 0.354 0.314 0.279 0.266 0.233 0.404 0.351 0.305 0.703 0.645 0.592 0.500 0.424 0.361 0.308 0.263 0.225 0.194 0.820 0.744 0.676 0.614 0.558 0.463 0.386 0.322 0.270 0.227 0.191 0.162 Period 11 0.896 Period 12 0.887 Period 13 0.879 0.773 Period 14 0.870 0.758 0.804 0.722 0.788 0.701 0.681 0.661 0.577 0.650 0.625 0.557 0.601 0.530 0.585 0.527 0.429 0.350 0.287 0.237 0.195 0.162 0.135 0.497 0.397 0.319 0.257 0.469 0.368 0.290 0.229 0.505 0.442 0.340 0.263 0.205 Period 15 0.861 0.743 0.642 0.555 0.481 0.417 0.315 0.239 0.183 0.208 0.168 0.137 0.112 0.182 0.145 0.116 0.093 0.160 0.125 0.099 0.078 0.140 0.108 0.084 0.065 Period 20 0.820 0.673 0.554 0.456 0.377 0.312 0.215 0.149 0.104 Period 25 0.780 0.610 Period 30 0.742 0.552 Period 40 0.672 0.453 0.478 0.375 0.295 0.233 0.146 0.092 0.059 0.073 0.051 0.037 0.026 0.038 0.024 0.016 0.010 0.412 0.308 0.231 0.174 0.099 0.057 0.033 0.020 0.012 0.007 0.004 0.307 0.208 0.142 0.097 0.046 0.022 0.011 0.005 0.003 0.001 0.001 Future Value of Annuity of $1 Periods 1% 2% 3% 4% 5% Period 1 1.000 1.000 1.000 1.000 1.000 6% 8% 10% 1.000 1.000 1.000 12% 14% 16% 18% 20% 1.000 1.000 1.000 1.000 1.000 Period 2 2.010 2.020 2.030 2.040 2.050 2.060 2.080 2.100 2.120 2.140 2.160 2.180 2.200 Period 3 3.030 3.060 3.091 3.122 3.153 3.184 3.246 3.310 3.374 3.440 3.506 3.572 3.640 Period 4 4.060 4.122 4.184 4.246 4.310 4.375 4.506 4.641 4.779 4.921 5.066 5.215 5.368 Period 5 5.101 5.204 5.309 5.416 5.526 5.637 5.867 6.105 6.353 6.610 6.877 7.154 7.442 Period 6 6.152 6.308 6.468 6.633 6.802 6.975 7.336 7.716 8.115 8.536 8.977 9.442 9.930 Period 7 7.214 7.434 7.662 7.898 8.142 8.394 8.923 9.487 10.089 10.730 11.414 12.142 12.916 Period 8 Period 9 9.369 8.286 8.583 8.892 9.214 9.549 9.897 10.637 11.436 12.300 13.233 14.240 15.327 16.499 9.755 10.159 10.583 11.027 11.491 12.488 13.579 14.776 16.085 17.519 19.086 20.799 Period 10 10.462 10.950 11.464 12.006 12.578 13.181 14.487 15.937 17.549 19.337 21.321 23.521 25.959 Period 11 11.567 12.169 12.808 13.486 14.207 14.972 16.645 18.531 20.655 Period 12 12.683 13.412 14.192 15.026 15.917 16.870 18.977 21.384 24.133 Period 13 13.809 14.680 15.618 16.627 17.713 18.882 21.495 24.523 28.029 Period 14 14.947 15.974 17.086 18.292 19.599 21.015 24.215 27.975 32.393 Period 15 16.097 17.293 18.599 20.024 21.579 Period 20 23.045 25.733 28.755 32.150 27.271 32.089 36.786 42.219 30.850 34.931 39.581 48.497 37.581 43.672 50.818 59.196 23.276 27.152 31.772 37.280 43.842 51.660 60.965 72.035 Period 25 Period 30 Period 40 22.019 24.297 26.870 29.778 33.066 36.786 45.762 57.275 72.052 28.243 32.030 36.459 41.646 47.727 54.865 73.106 98.347 133.334 34.785 40.568 47.575 56.085 66.439 79.058 113.283 164.494 241.333 356.787 530.312 790.948 1,181.882 48.886 60.402 75.401 95.026 120.800 154.762 259.057 442.593 767.091 1,342.025 2,360.757 4,163.213 7,343.858 91.025 115.380 146.628 186.688 181.871 249.214 342.603 471.981 Future Value of $1 Periods 1% 2% 3% 4% 5% Period 1 1.010 1.020 1.030 1.040 1.050 6% 8% 1.060 1.080 Period 2 1.020 1.040 1.061 1.082 1.103 Period 3 1.030 1.061 1.093 1.125 1.158 Period 4 1.041 1.082 1.126 1.170 1.216 Period 5 1.051 1.104 1.159 1.217 1.276 1.124 1.166 1.191 1.260 1.262 1.360 1.464 1.338 1.469 1.611 10% 12% 14% 16% 1.100 1.120 1.140 1.210 1.254 1.300 1.331 1.405 1.482 1.561 1.574 1.689 1.811 1.939 2.074 18% 20% 1.160 1.180 1.200 1.346 1.392 1.440 1.643 1.728 1.762 1.925 2.100 2.288 2.488 Period 6 1.062 1.126 1.194 1.265 1.340 1.419 1.587 1.772 1.974 2.195 2.436 2.700 2.986 Period 7 1.072 1.149 1.230 1.316 1.407 1.504 1.714 1.949 2.211 2.502 2.826 3.185 3.583 Period 8 1.083 1.172 1.267 1.369 1.477 1.594 1.851 2.144 2.476 2.853 3.278 3.759 4.300 Period 9 1.094 1.195 1.305 1.423 1.551 1.689 1.999 2.358 2.773 3.252 3.803 4.435 5.160 Period 10 1.105 1.219 1.344 1.480 1.629 1.791 2.159 2.594 3.106 3.707 4.411 5.234 6.192 Period 11 1.116 1.243 1.384 1.539 1.710 1.898 2.332 2.853 3.479 4.226 5.117 6.176 7.430 Period 12 1.127 1.268 1.426 1.601 1.796 2.012 2.518 3.138 3.896 4.818 5.936 7.288 8.916 Period 13 Period 14 Period 15 1.161 Period 20 Period 25 1.282 Period 30 1.348 Period 40 1.489 1.138 1.294 1.469 1.665 1.886 2.133 2.720 3.452 4.363 5.492 6.886 8.599 10.699 1.149 1.319 1.513 1.732 1.980 2.261 2.937 3.797 4.887 6.261 7.988 10.147 12.839 1.346 1.558 1.801 2.079 2.397 3.172 4.177 5.474 7.138 9.266 11.974 15.407 1.220 1.486 1.806 2.191 2.653 3.207 4.661 6.727 9.646 1.641 2.094 2.666 3.386 1.811 2.427 2.208 3.262 3.243 4.322 4.801 7.040 13.743 19.461 27.393 38.338 4.292 6.848 10.835 17.000 26.462 40.874 62.669 95.396 5.743 10.063 17.449 29.960 50.950 85.850 143.371 237.376 10.286 21.725 45.259 93.051 188.884 378.721 750.378 1.469.772 Tidal Wave is considering purchasing a water park in Charlotte, North Carolina, for $2,300,000. The new facility will generate annual net cash inflows of $520,000 for ten years. Engineers estimate that the facility will remain useful for ten years and have no residual value. The company uses straight-line depreciation. Its owners want payback in less than five years and an ARR of 10% or more. Management uses a 14% hurdle rate on investments of this nature. Requirement 1. Compute the payback period, the ARR, the NPV, and the approximate IRR of this investment. (If you use the tables to compute the IRR, answer with the closest interest rate shown in the tables.) Requirement 2. Recommend whether the company should invest in this project.
Expert Answer:

Related Book For 
Posted Date:
Students also viewed these finance questions
-
Splash World is considering purchasing a water park in Charlotte, North Carolina, for $ 2,000,000. The new facility will generate annual net cash inflows of $ 520,000 for ten years. Engineers...
-
Water World is considering purchasing a water park in British Columbia for $1,850,000. The new facility will generate annual net cash inflows of $520,000 for eight years. Engineers estimate that the...
-
You are developing an industrial building with a gross building area of 150,000 sf. The building efficiency ratio is 75%. The market gross rent is $25 psf. The vacancy rate is 5%; the cap rate is 5%;...
-
Graph the updating functions associated with the following discrete-time dynamical systems, and cobweb for five steps starting from the given initial condition. xt+1 = 2xt - 1, starting from x0 = 2.
-
When is an operating lease counter productive in business? Explain.
-
With reference to Exercise 3.7, suppose that each point \((i, j)\) of the sample space is assigned the probability \(\frac{420 / 401}{2(i+j)}\). (a) Verify that this assignment of probabilities is...
-
On January 1, 2012, Parker, Inc., a U.S.-based firm, acquired 100 percent of Suffolk PLC located in Great Britain for consideration paid of 52,000,000 British pounds (), which was equal to fair...
-
Design Fixings and brackets to attach the highlited red boxes, Please ignore the dimensions and numbers and descriptions please just look at the titles. If i can just have quick sketch that would be...
-
XYZ Company sells products X and Y to business customers. After implementing activity-based Costing to estmate customer-level technical support costs, the company found that customer A is profitable...
-
questions. For below program coded by C programing language, answer the following int Sum(int a[], int n) n: the length of array a { int s=0; for(i=0;i
-
Consider the thin (steel) 200 mm long tapered plate varying width from 40 mm to 5 mm along the length. Plate is fixed at the top. The plate has uniform thickness t = 1 mm, Young's modulus E = 200 x...
-
You work for a supermarket chain company named "Super." The general manager wants to have an understanding of the company's stock as compared with two major competitors, Walmart, and Target. The...
-
1. Suppose at time 0, the initial estimate y(0) of the RTT equal to the true value ro. But immediately after time 0, the true value of RTT for the connection increases to R and remains at that R. for...
-
4. Consider the function. f(x, y, z)=x+y+z+sin (az) - e-(2+y +2). Write a code that evaulates the Hessian matrix for any choice of r, y and 2. 5. Generate a random vector in matrix with entries = [1,...
-
Do you feel that if the media was to make a show that was more realistic when it came to family that people would watch it? Or would there not be enough drama as well as enough of an escape for...
-
Evaluate the function at the given value(s) of the independent variable. Simplify the results. (x) = cos 2x (a) (0) (b) (- /4) (c) (/3) (d) ()
-
Define a closely held corporation.
-
Explain the role played by a board of directors of a corporation.
-
Explain the steps in forming a limited liability corporation.

Study smarter with the SolutionInn App