

Question: Compute the pooled t-test statistics value for Age (years) in this table using the summary statistics provided. The two-tailed p-value for Age reported in Table
Compute the pooled t-test statistics value for Age (years) in this table using the summary statistics provided.
The two-tailed p-value for Age reported in Table 1 is 0.047, which is correct if we consider this a
pooled t-test.
Summary statistics: Noninfected n = 90 Infected n - 60 p value
Age years 64.8 + 11.8 68.6 + 11.0 0.047
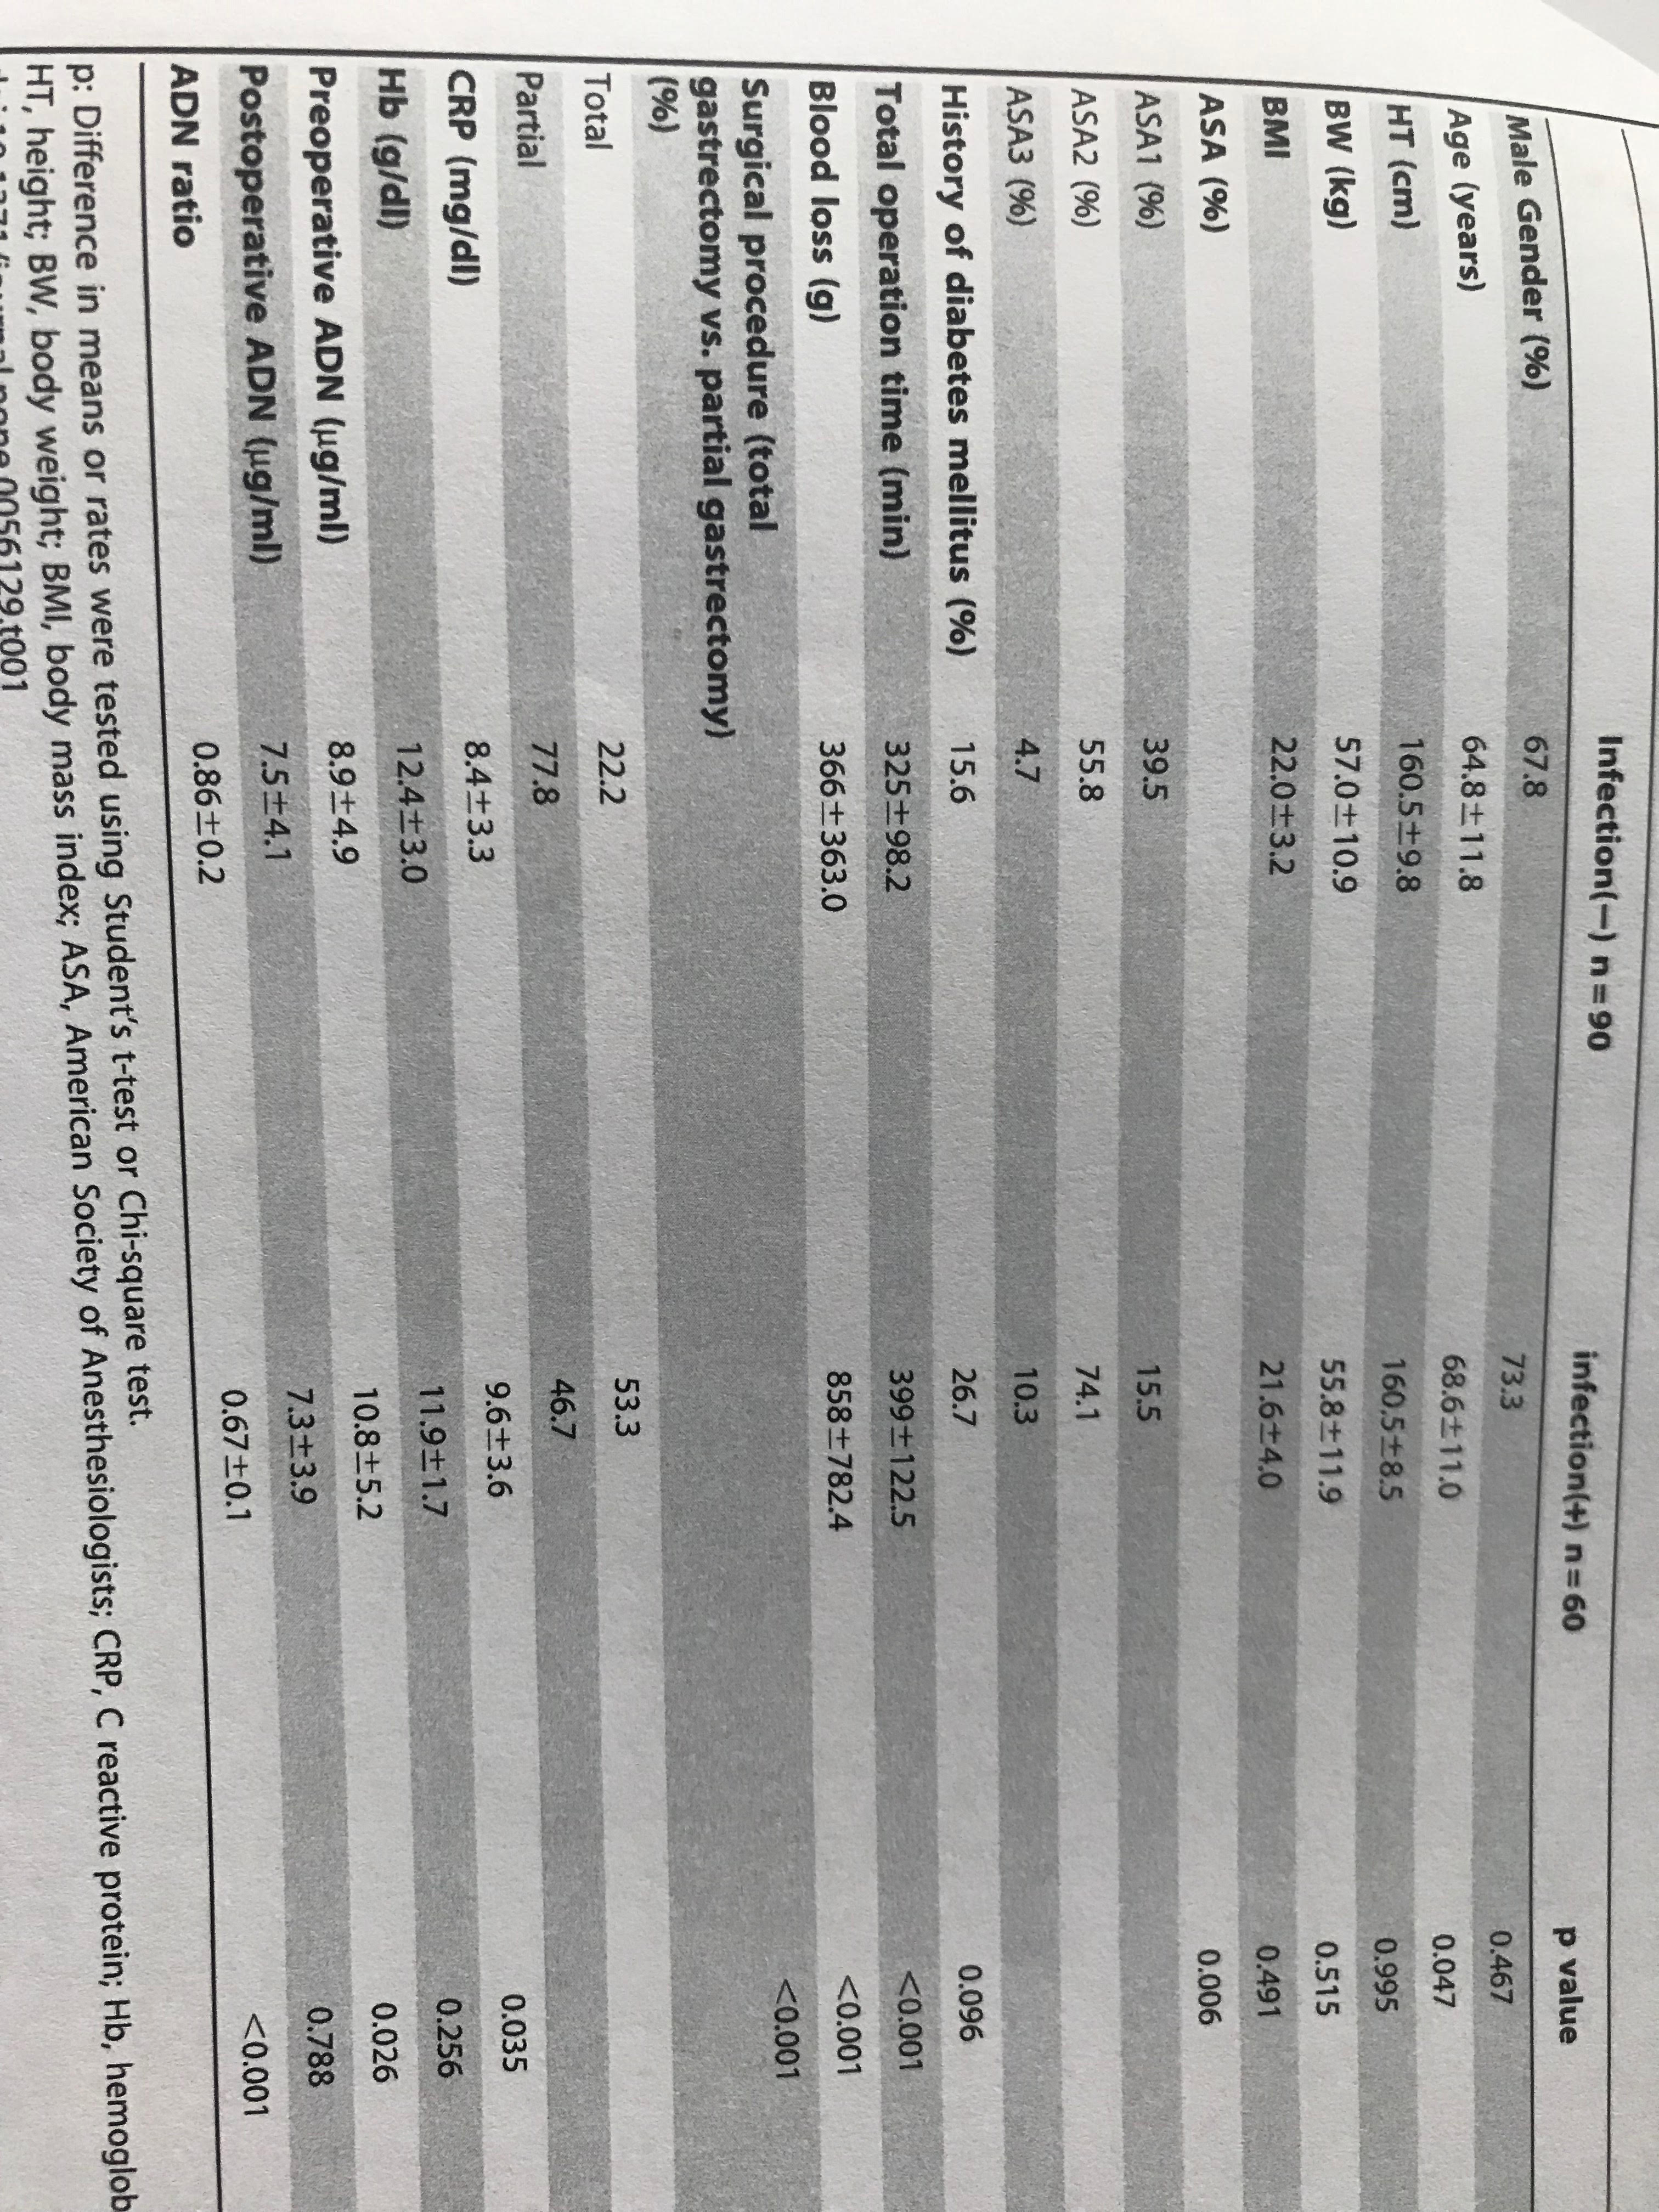
Infection(-) n =90 Male Gender (%) 67.8 infection(+) n=60 p value Age (years) 64.8+11.8 73.3 0.467 68.6+11.0 HT (cm) 160.5+9.8 0.047 160.5+8.5 BW (kg) 57.0+10.9 0.995 55.8+11.9 BMI 22.0+3.2 0.515 21.6+4.0 ASA (%) 0.491 0.006 ASA1 (%) 39.5 15.5 ASA2 (%) 55.8 74.1 ASA3 (%) 10.3 History of diabetes mellitus (%) 15.6 26.7 0.096 Total operation time (min) 325+98.2 399+ 122.5
Step by Step Solution
There are 3 Steps involved in it

Get step-by-step solutions from verified subject matter experts