

Question: Compute the sample mean RETURN (r-bar) for each stock 2. Compute the sample standard deviation (s) of the RETURN for each stock 3. Compute the
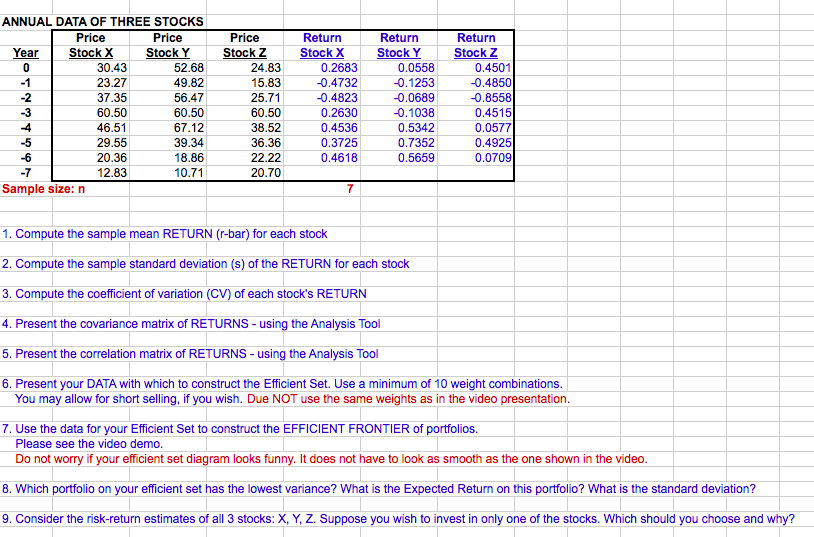
Compute the sample mean RETURN (r-bar) for each stock 2. Compute the sample standard deviation (s) of the RETURN for each stock 3. Compute the coefficient of variation (CV) of each's RETURNS 4. Present the covariance matrix of RETURNS - using the Analysis Tool 5. Present the correlation matrix of RETURNS - using the Analysis Tool 6. Present your DATA with which to construct the Efficient Set. Use a minimum of 10 weight combinations. You may allow for short selling, if you wish. Due NOT use the same weights as in the video presentation. 7. Use the data for your Efficient Set to construct the EFFICIENT FRONTIER of portfolios. Please see the video demo. Do not worry if your efficient set diagram looks funny. It does not have to look as smooth as the one shown in the video. 8. Which portfolio on your efficient set has the lowest variance? What is Expected Return on this portfolio? What is the standard deviation? 9. Consider the risk-return estimates of all 3 stocks: X, Y, Z. Suppose you wish to invest in only one of the stocks. Which should you choose and why
Step by Step Solution
There are 3 Steps involved in it

Get step-by-step solutions from verified subject matter experts