

Question: Compute the share value using the free cash flow to firm and free cash flow to equity. Statoils common stock price per share (September 30,
Compute the share value using the free cash flow to firm and free cash flow to equity.
Statoils common stock price per share (September 30, 2006) $23.84
Statoils equity beta (based on Value Line, October, 2006) 0.95
Market risk premium (from Dimson, Marsh and Staunton) 5.5%
Yield to maturity on A-rated debt (October 2006) 6.36%
Yield to maturity on Baa-rated debt (October 2006) 6.94%
Yield to maturity on 30-year Treasury Bond (October 2006) 4.80%
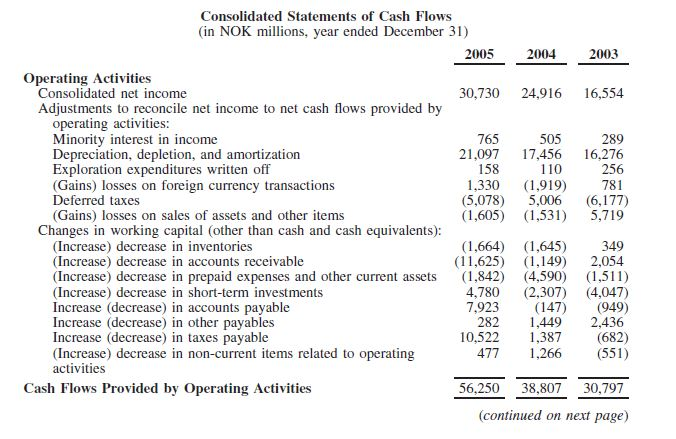
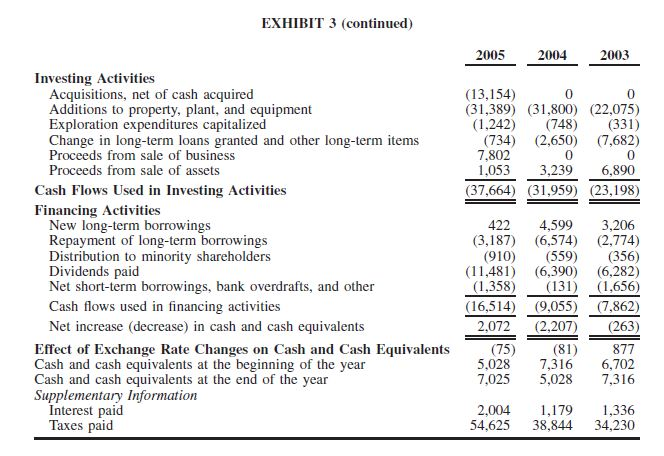
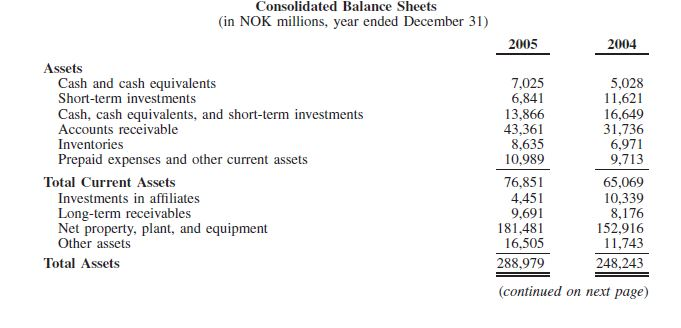
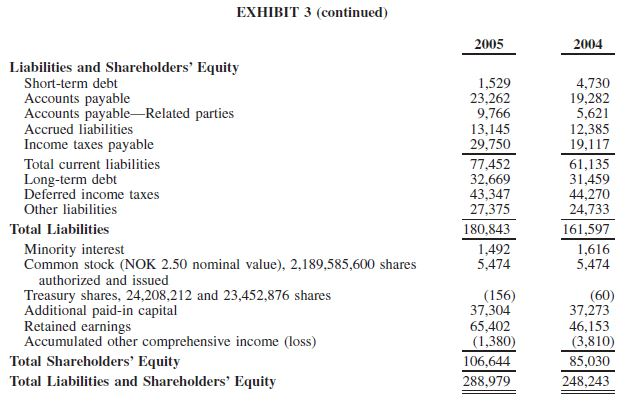
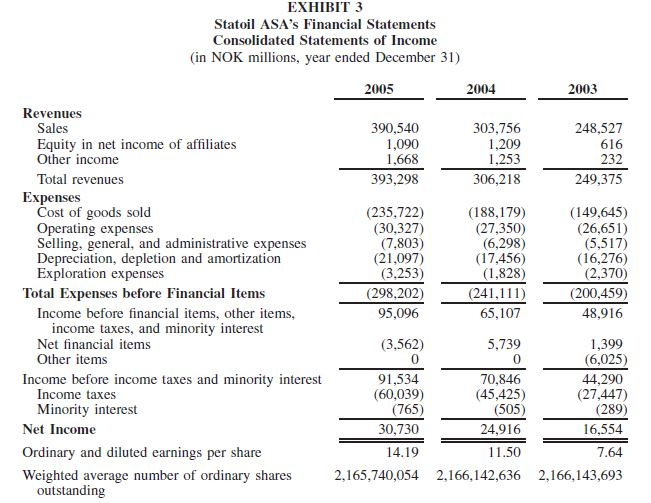
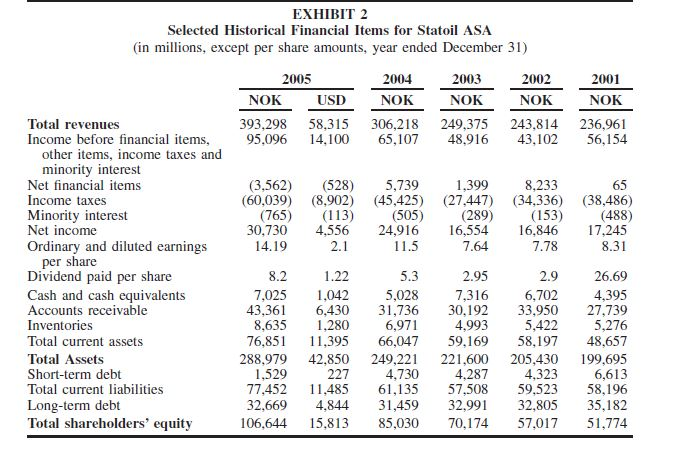
Consolidated Statements of Cash Flows (in NOK millions, year ended December 31) 2005 2004 2003 30,730 24,916 16,554 765 21,097 158 1,330 (5,078) (1,605) 505 17,456 110 (1,919) 5,006 (1,531) 289 16,276 256 781 (6,177) 5,719 Operating Activities Consolidated net income Adjustments to reconcile net income to net cash flows provided by operating activities: Minority interest in income Depreciation, depletion, and amortization Exploration expenditures written off (Gains) losses on foreign currency transactions Deferred taxes (Gains) losses on sales of assets and other items Changes in working capital (other than cash and cash equivalents): (Increase) decrease in inventories (Increase) decrease in accounts receivable (Increase) decrease in prepaid expenses and other current assets (Increase) decrease in short-term investments Increase (decrease) in accounts payable Increase (decrease) in other payables Increase (decrease) in taxes payable (Increase) decrease in non-current items related to operating activities Cash Flows Provided by Operating Activities (1,664) (11,625) (1,842) 4,780 7,923 282 10,522 477 (1,645) (1,149) (4,590) (2,307) (147) 1,449 1,387 1,266 349 2,054 (1,511) (4,047) (949) 2,436 (682) (551) 56,250 38,807 30,797 (continued on next page) EXHIBIT 3 (continued) 2005 2004 2003 (31,389) (31,800) (22,075) (1,242) (748) (331) (734) (2,650) (7,682) 1,053 3,2396,890 (37,664) (31,959) (23,198) Investing Activities Acquisitions, net of cash acquired Additions to property, plant, and equipment Exploration expenditures capitalized Change in long-term loans granted and other long-term items Proceeds from sale of business Proceeds from sale of assets Cash Flows Used in Investing Activities Financing Activities New long-term borrowings Repayment of long-term borrowings Distribution to minority shareholders Dividends paid Net short-term borrowings, bank overdrafts, and other Cash flows used in financing activities Net increase (decrease) in cash and cash equivalents Effect of Exchange Rate Changes on Cash and Cash Equivalents Cash and cash equivalents at the beginning of the year Cash and cash equivalents at the end of the year Supplementary Information Interest paid Taxes paid (3,187) (910) (11,481) (1,358) (16,514) 2,072 (6,574) (559) (6,390) (131) (9,055) (2,207) (2,774) (356) (6,282) (1,656) (7,862) (263) 5,028 7,316 6,702 2,004 54,625 1,1791,336 38,844 34,230 Consolidated Balance Sheets (in NOK millions, year ended December 31) 2005 2004 7,025 6,841 5,028 11,621 16,649 31,736 6,971 9.713 Assets Cash and cash equivalents Short-term investments Cash, cash equivalents, and short-term investments Accounts receivable Inventories Prepaid expenses and other current assets Total Current Assets Investments in affiliates Long-term receivables Net property, plant, and equipment Other assets Total Assets 13,866 43,361 8,635 10,989 76,851 4,451 9,691 181,481 16,505 288,979 65,069 10,339 8,176 152,916 11.743 248.243 (continued on next page) EXHIBIT 3 (continued) 2005 2004 Liabilities and Shareholders' Equity Short-term debt Accounts payable Accounts payable-Related parties Accrued liabilities Income taxes payable Total current liabilities Long-term debt Deferred income taxes Other liabilities Total Liabilities Minority interest Common stock (NOK 2.50 nominal value), 2,189,585,600 shares authorized and issued Treasury shares, 24,208,212 and 23,452,876 shares Additional paid-in capital Retained earnings Accumulated other comprehensive income (loss) Total Shareholders' Equity Total Liabilities and Shareholders' Equity 1,529 23,262 9,766 13,145 29,750 77,452 32,669 43,347 27,375 180,843 1,492 5,474 4,730 19,282 5,621 12,385 19,117 61,135 31,459 44,270 24,733 161,597 1,616 5,474 (156) 37,304 65,402 (1,380) 106,644 288,979 (60) 37,273 46,153 (3,810) 85,030 248,243 EXHIBIT 3 Statoil ASA's Financial Statements Consolidated Statements of Income (in NOK millions, year ended December 31) 2005 2004 2003 390,540 1,090 1,668 393,298 303,756 1,209 1,253 306,218 248,527 616 232 249,375 Revenues Sales Equity in net income of affiliates Other income Total revenues Expenses Cost of goods sold Operating expenses Selling, general, and administrative expenses Depreciation, depletion and amortization Exploration expenses Total Expenses before Financial Items Income before financial items, other items, income taxes, and minority interest Net financial items Other items Income before income taxes and minority interest Income taxes Minority interest Net Income Ordinary and diluted earnings per share Weighted average number of ordinary shares outstanding (235,722) (30,327) (7.803) (21,097) (3,253) (298,202) 95,096 (188,179) (27,350) (6,298) (17,456) (1,828) (241,111) 65,107 (149,645) (26,651) (5,517) (16,276) (2,370) (200,459) 48,916 (3,562) 5,739 0 91,534 (60,039) (765) 30,730 14.19 2,165,740,054 70,846 (45,425) (505) 24,916 11.50 2,166,142,636 1,399 (6,025) 44,290 (27,447) (289) 16,554 7.64 2,166,143,693 EXHIBIT 2 Selected Historical Financial Items for Statoil ASA (in millions, except per share amounts, year ended December 31) 2005 NOK USD 393,298 58,315 95,096 14,100 2004 NOK 306,218 65,107 2003 NOK 249,375 48.916 2002 NOK 243.814 43,102 2001 NOK 236,961 56,154 (3,562) (60,039) (765) 30,730 14.19 (528) (8.902) (113) 4.556 2.1 5,739 (45,425) (505) 24,916 11.5 1,399 (27,447) (289) 16,554 7.64 8,233 (34,336) (153) 16,846 7.78 65 (38,486) (488) 17.245 8.31 Total revenues Income before financial items, other items, income taxes and minority interest Net financial items Income taxes Minority interest Net income Ordinary and diluted earnings per share Dividend paid per share Cash and cash equivalents Accounts receivable Inventories Total current assets Total Assets Short-term debt Total current liabilities Long-term debt Total shareholders' equity 8.2 1.22 7,025 1,042 43,361 6,430 8,635 1,280 76,851 11,395 288.97942.850 1,529 227 77,452 11,485 32,669 4,844 106,644 15.813 5.3 2.95 5,028 7,316 31,736 30,192 6,971 4,993 66,047 59,169 249,221 221,600 4.730 4 ,287 61,135 57,508 31,459 32,991 85,030 70,174 2.9 6,702 33.950 5,422 58,197 205,430 4,323 59,523 32,805 57,017 26.69 4,395 27,739 5,276 48,657 199,695 6,613 58.196 35.182 51,774
Step by Step Solution
There are 3 Steps involved in it

Get step-by-step solutions from verified subject matter experts