

Question: Compute the test value. Question b (1 point) Attempt 2 of Unlimited | View question in a popup 11.1 Section Truck Colors In a recent
Compute the test value.
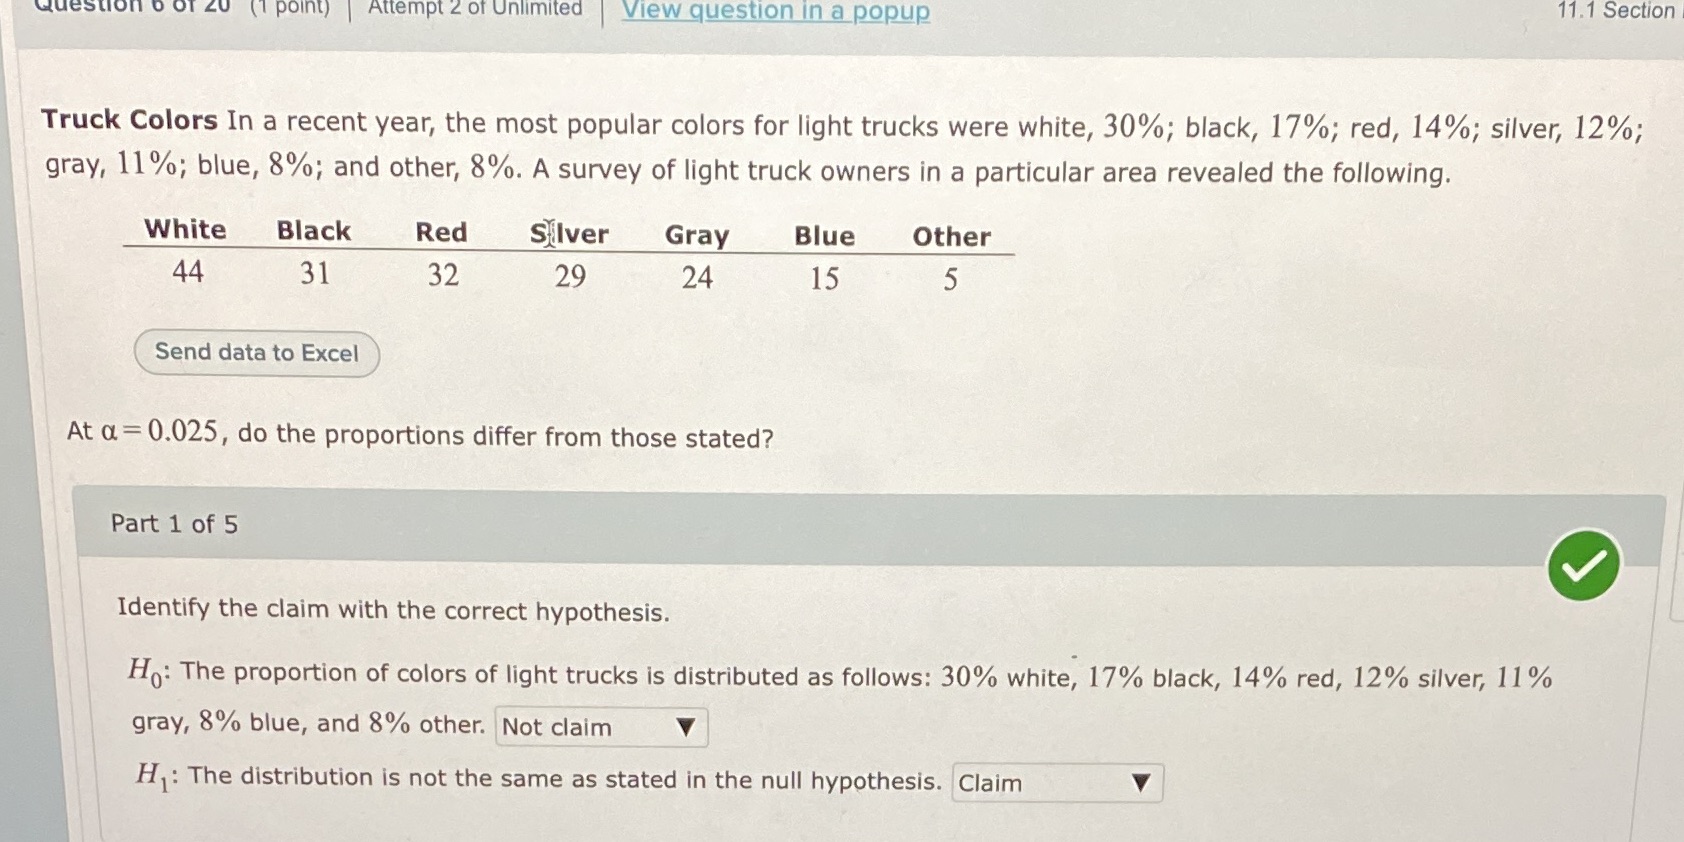
Question b (1 point) Attempt 2 of Unlimited | View question in a popup 11.1 Section Truck Colors In a recent year, the most popular colors for light trucks were white, 30%; black, 17%; red, 14%; silver, 12%; gray, 11%; blue, 8%; and other, 8%. A survey of light truck owners in a particular area revealed the following. White Black Red Silver Gray Blue Other 44 31 32 29 24 15 5 Send data to Excel At a = 0.025, do the proportions differ from those stated? Part 1 of 5 Identify the claim with the correct hypothesis. Ho: The proportion of colors of light trucks is distributed as follows: 30% white, 17% black, 14% red, 12% silver, 11% gray, 8% blue, and 8% other. Not claim H : The distribution is not the same as stated in the null hypothesis. Claim
Step by Step Solution
There are 3 Steps involved in it

Get step-by-step solutions from verified subject matter experts