

Question: computer Science.... ( 2 0 pts ) Use Tableau for this question. Open the GM cars dataset included with this assignment ( gmcar _ price.txt
computer Science....
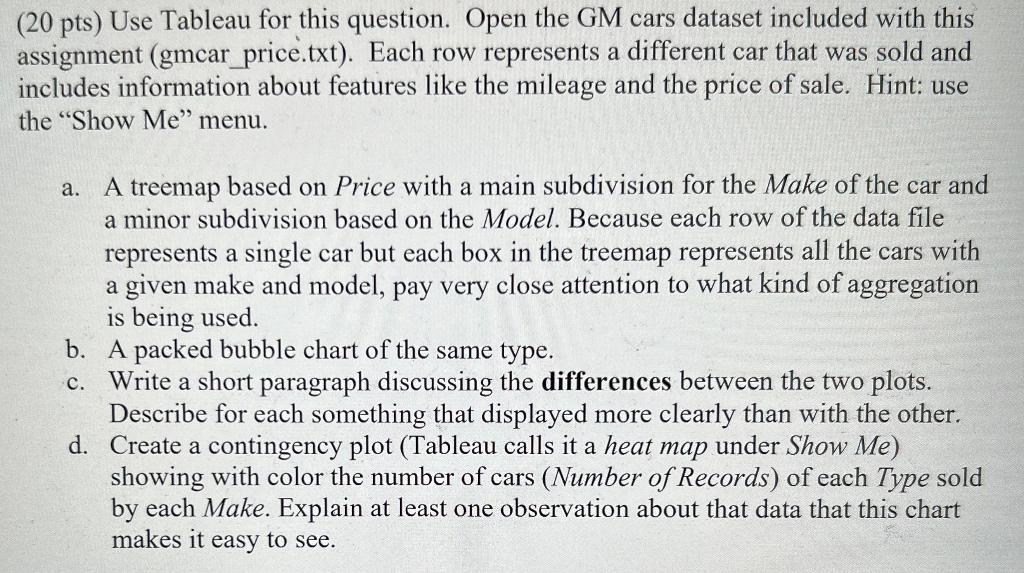
pts Use Tableau for this question. Open the GM cars dataset included with this assignment gmcarprice.txt Each row represents a different car that was sold and includes information about features like the mileage and the price of sale. Hint: use the "Show Me menu.
a A treemap based on Price with a main subdivision for the Make of the car and a minor subdivision based on the Model. Because each row of the data file represents a single car but each box in the treemap represents all the cars with a given make and model, pay very close attention to what kind of aggregation is being used.
b A packed bubble chart of the same type.
c Write a short paragraph discussing the differences between the two plots. Describe for each something that displayed more clearly than with the other.
d Create a contingency plot Tableau calls it a heat map under Show Me showing with color the number of cars Number of Records of each Type sold by each Make. Explain at least one observation about that data that this chart makes it easy to see.
Step by Step Solution
There are 3 Steps involved in it
1 Expert Approved Answer
Step: 1 Unlock

Question Has Been Solved by an Expert!
Get step-by-step solutions from verified subject matter experts
Step: 2 Unlock
Step: 3 Unlock