

Question: Computer Science Data Science problems Language: Python I will give thumb up! Thank you! may be useful link for part d:https://matplotlib.org/api/_as_gen/matplotlib.pyplot.errorbar.html Part A: Your friends
Computer Science Data Science problems
Language: Python
I will give thumb up! Thank you!
may be useful link for part d:https://matplotlib.org/api/_as_gen/matplotlib.pyplot.errorbar.html
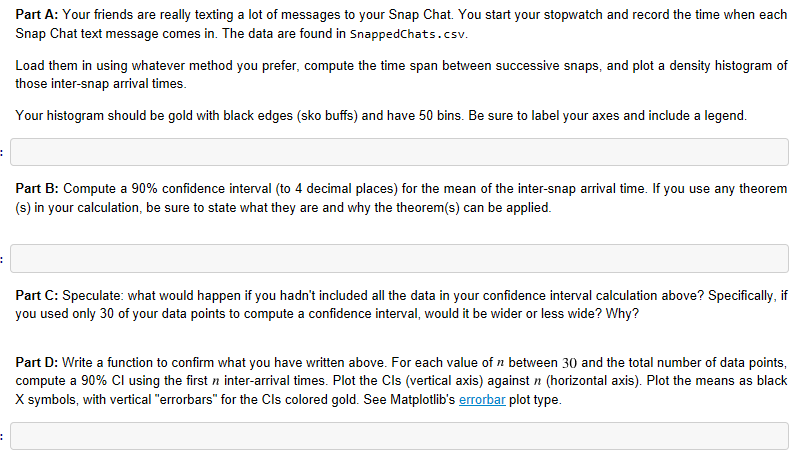
Part A: Your friends are really texting a lot of messages to your Snap Chat. You start your stopwatch and record the time when each Snap Chat text message comes in. The data are found in SnappedChats.csv. Load them in using whatever method you prefer, compute the time span between successive snaps, and plot a density histogram of those inter-snap arrival times. Your histogram should be gold with black edges (sko buffs) and have 50 bins. Be sure to label your axes and include a legend. Part B: Compute a 90% confidence interval (to 4 decimal places) for the mean of the inter-snap arrival time. If you use any theorem (s) in your calculation, be sure to state what they are and why the theorem(s) can be applied. Part C: Speculate: what would happen if you hadn't included all the data in your confidence interval calculation above? Specifically, if you used only 30 of your data points to compute a confidence interval, would it be wider or less wide? Why? Part D: Write a function to confirm what you have written above. For each value of n between 30 and the total number of data points, compute a 90% CI using the first n inter-arrival times. Plot the CIs (vertical axis) against n (horizontal axis). Plot the means as black X symbols, with vertical "errorbars" for the Cls colored gold. See Matplotlib's errorbar plot type Part A: Your friends are really texting a lot of messages to your Snap Chat. You start your stopwatch and record the time when each Snap Chat text message comes in. The data are found in SnappedChats.csv. Load them in using whatever method you prefer, compute the time span between successive snaps, and plot a density histogram of those inter-snap arrival times. Your histogram should be gold with black edges (sko buffs) and have 50 bins. Be sure to label your axes and include a legend. Part B: Compute a 90% confidence interval (to 4 decimal places) for the mean of the inter-snap arrival time. If you use any theorem (s) in your calculation, be sure to state what they are and why the theorem(s) can be applied. Part C: Speculate: what would happen if you hadn't included all the data in your confidence interval calculation above? Specifically, if you used only 30 of your data points to compute a confidence interval, would it be wider or less wide? Why? Part D: Write a function to confirm what you have written above. For each value of n between 30 and the total number of data points, compute a 90% CI using the first n inter-arrival times. Plot the CIs (vertical axis) against n (horizontal axis). Plot the means as black X symbols, with vertical "errorbars" for the Cls colored gold. See Matplotlib's errorbar plot type
Step by Step Solution
There are 3 Steps involved in it

Get step-by-step solutions from verified subject matter experts