

Question: Computing and Analyzing Cash Flow Ratios Selected financial information for Snap Inc. and Golden Eagle Inc. follows. Golden ($ millions) Snap Eagle Current liabilities, January
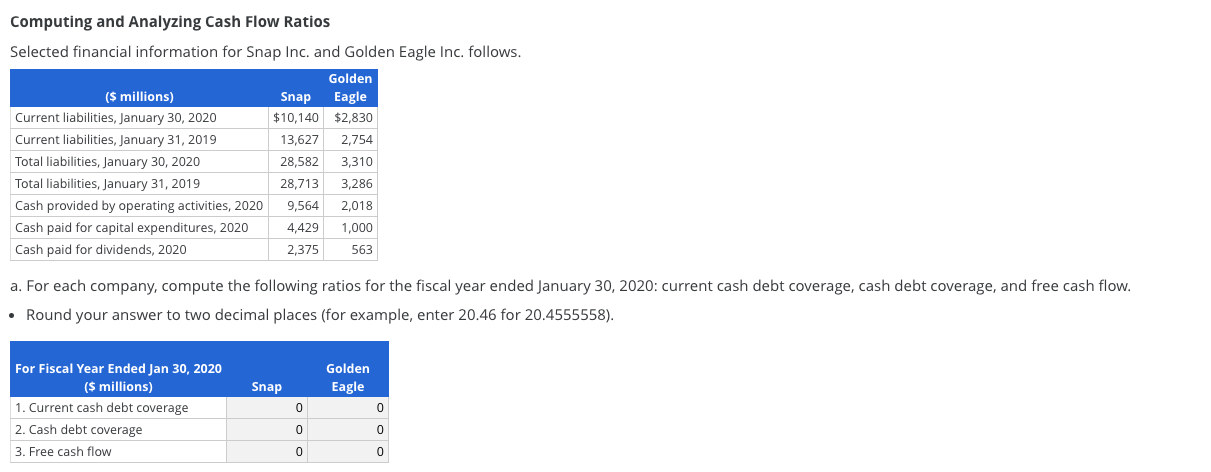
Computing and Analyzing Cash Flow Ratios Selected financial information for Snap Inc. and Golden Eagle Inc. follows. Golden ($ millions) Snap Eagle Current liabilities, January 30, 2020 $10,140 $2,830 Current liabilities, January 31, 2019 13,627 2,754 Total liabilities, January 30, 2020 28,582 3,310 Total liabilities, January 31, 2019 28,713 3,286 Cash provided by operating activities, 2020 9,564 2,018 Cash paid for capital expenditures, 2020 4,429 1,000 Cash paid for dividends, 2020 2,375 563 a. For each company, compute the following ratios for the fiscal year ended January 30, 2020: current cash debt coverage, cash debt coverage, and free cash flow. Round your answer to two decimal places (for example, enter 20.46 for 20.4555558). Golden Eagle Snap For Fiscal Year Ended Jan 30, 2020 ($ millions) 1. Current cash debt coverage 2. Cash debt coverage 3. Free cash flow 0 0 0 0 0 0
Step by Step Solution
There are 3 Steps involved in it

Get step-by-step solutions from verified subject matter experts