

Question: Computing and Analyzing Stockholders' Equity Ratios The balance sheets for Crosby Inc. and Gretzky Company reflect the following. Crosby Inc Gretzky Inc. Current liabilities $
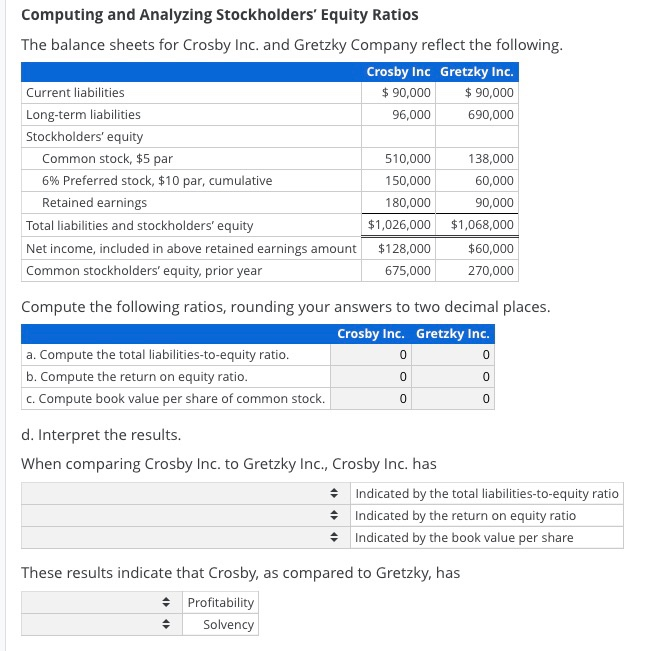
Computing and Analyzing Stockholders' Equity Ratios The balance sheets for Crosby Inc. and Gretzky Company reflect the following. Crosby Inc Gretzky Inc. Current liabilities $ 90,000 $ 90,000 Long-term liabilities 96,000 690,000 Stockholders' equity Common stock, $5 par 510,000 138,000 6% Preferred stock, $10 par, cumulative 150,000 60,000 Retained earnings 180,000 90,000 Total liabilities and stockholders' equity $1,026,000 $1,068,000 Net income, included in above retained earnings amount $128,000 $60,000 Common stockholders' equity, prior year 675,000 270,000 Compute the following ratios, rounding your answers to two decimal places. Crosby Inc. Gretzky Inc. a. Compute the total liabilities-to-equity ratio. 0 0 b. Compute the return on equity ratio. 0 0 C. Compute book value per share of common stock. 0 0 d. Interpret the results. When comparing Crosby Inc. to Gretzky Inc., Crosby Inc. has Indicated by the total liabilities-to-equity ratio Indicated by the return on equity ratio Indicated by the book value per share These results indicate that Crosby, as compared to Gretzky, has Profitability Solvency
Step by Step Solution
There are 3 Steps involved in it

Get step-by-step solutions from verified subject matter experts