

Question: Computing and Interpreting Financial Statement Ratios Following are selected ratios of Norfolk Southern for 2018 and 2017. Return on Assets (ROA) Component 2018 2017
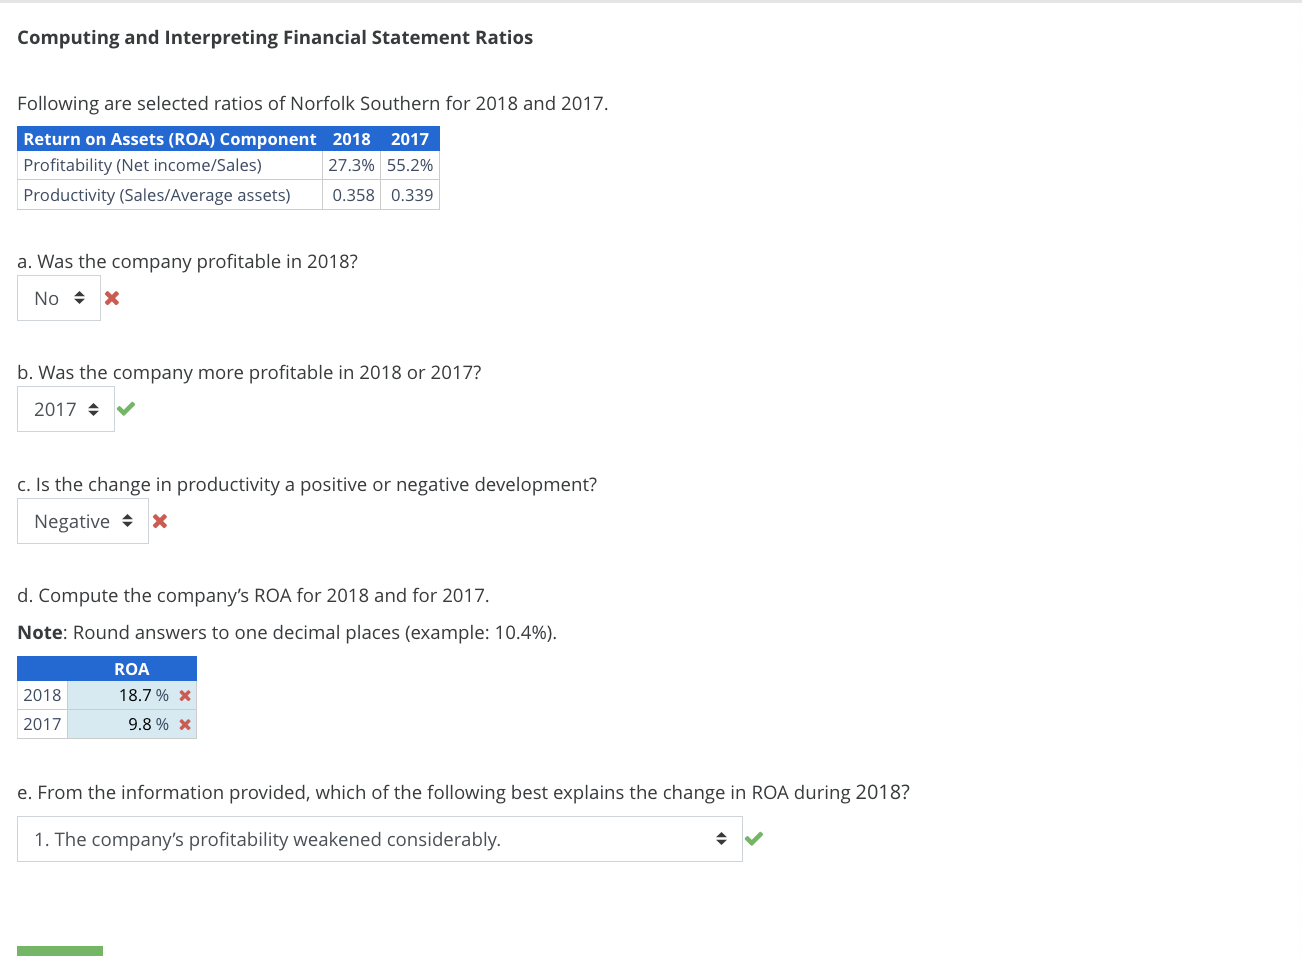
Computing and Interpreting Financial Statement Ratios Following are selected ratios of Norfolk Southern for 2018 and 2017. Return on Assets (ROA) Component 2018 2017 Profitability (Net income/Sales) 27.3% 55.2% Productivity (Sales/Average assets) 0.358 0.339 a. Was the company profitable in 2018? No x b. Was the company more profitable in 2018 or 2017? 2017 c. Is the change in productivity a positive or negative development? Negative x d. Compute the company's ROA for 2018 and for 2017. Note: Round answers to one decimal places (example: 10.4%). 2018 2017 ROA 18.7% x 9.8% x e. From the information provided, which of the following best explains the change in ROA during 2018? 1. The company's profitability weakened considerably.
Step by Step Solution
There are 3 Steps involved in it

Get step-by-step solutions from verified subject matter experts