

Question: Conceptual Overview: Explore how using different weights for averaging prior observations in a time series affects the forecast and the accuracy statistics. Averaging prior observations
Conceptual Overview: Explore how using different weights for averaging prior observations in a time series affects the forecast and the accuracy statistics.
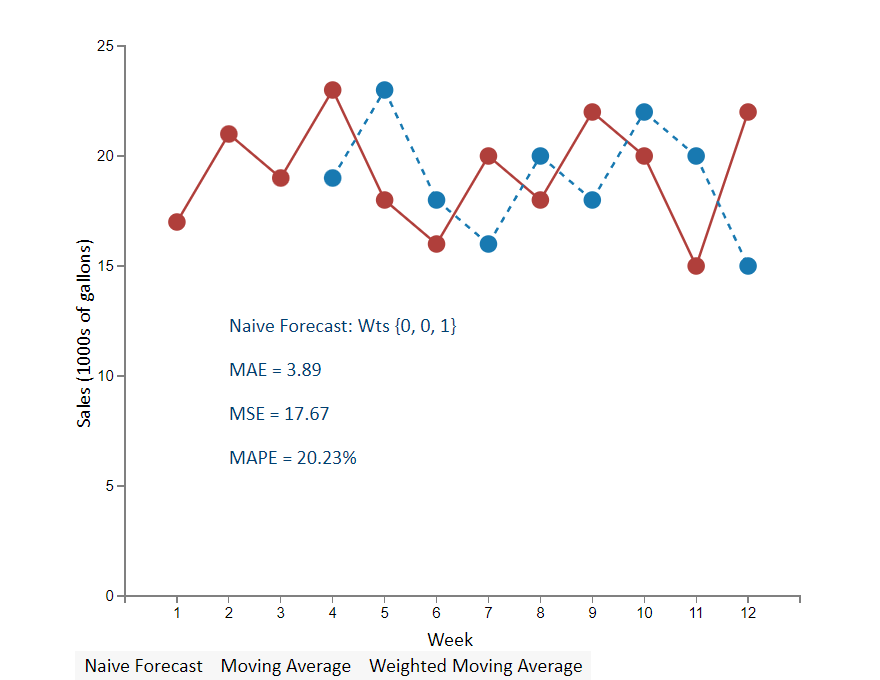
Averaging prior observations is often a good way to forecast future observations for relatively stable time series. In the graph, the red dots with solid lines represent the time series data and the blue dots with dotted lines represent the moving average forecast.
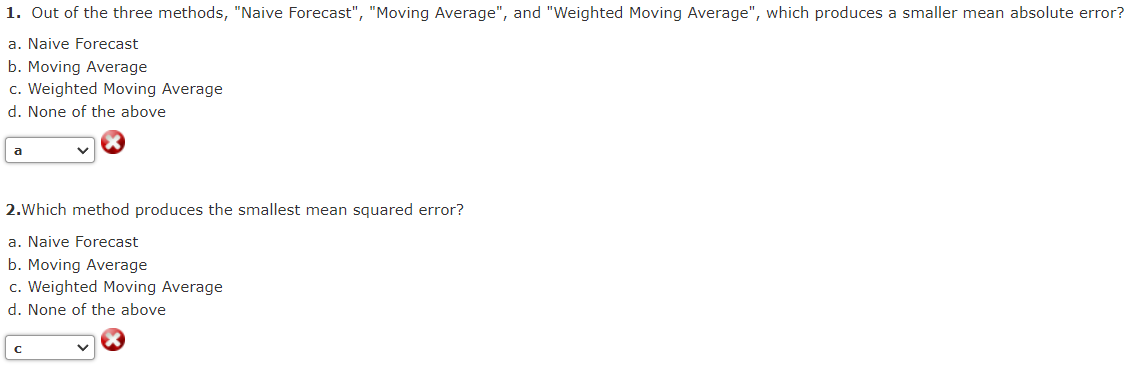
Use the buttons at the bottom to select different moving average methods for the prior three observations. The "Naive Forecast" uses only the immediate prior observation. The "Moving Average" gives equal weight to the three prior observations. The "Weighted Moving Average" weights observations by recency. Compare how the different weighting systems perform as forecasts, both visually and in terms of the statistics, MAE (mean absolute error), MSE (mean squared error), and MAPE (mean absolute percentage error).
Step by Step Solution
There are 3 Steps involved in it

Get step-by-step solutions from verified subject matter experts