Question: Conclusions from Experimental Data Portfolio Worksheet Directions: Use this worksheet to record your answers to the questions or problems for the Conclusions from Experimental Data
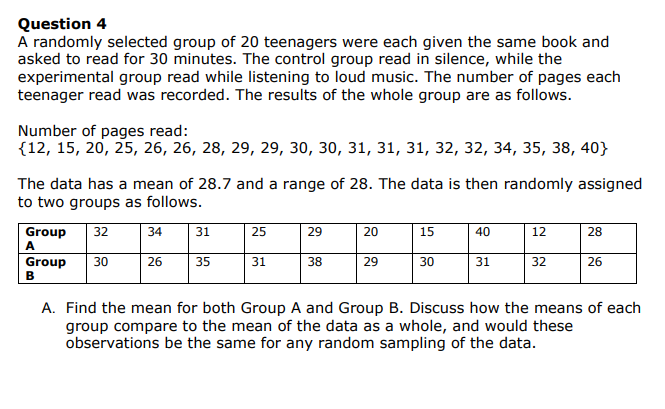
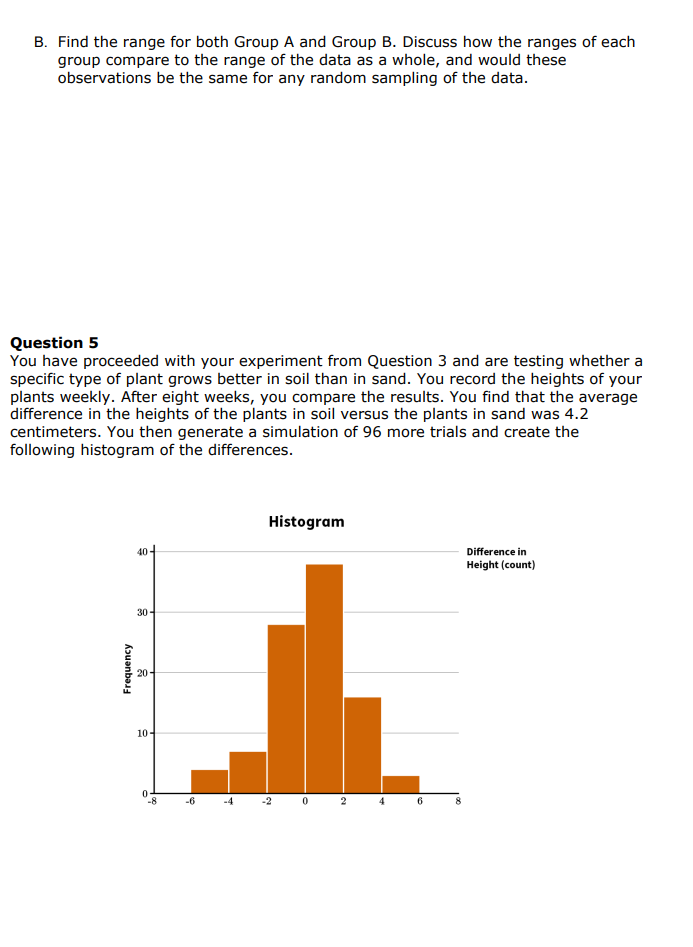
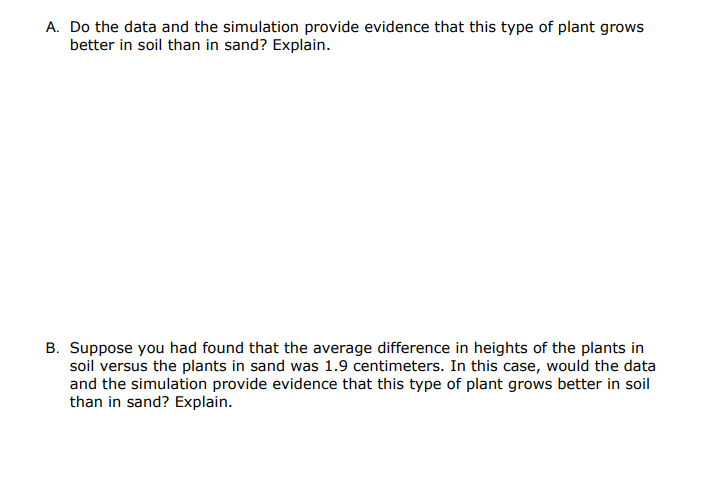
Conclusions from Experimental Data Portfolio Worksheet Directions: Use this worksheet to record your answers to the questions or problems for the Conclusions from Experimental Data portfolio. When you are finished, save this worksheet with your answers and submit it for a portfolio grade. Where indicated, draw figures on a blank sheet of paper or on a sheet of graph paper. Be sure to label each sheet so that your teacher knows which answer goes with which question. You can scan these figures and submit them as individual documents with your portfolio worksheet, or you can take pictures of them and insert the pictures on the portfolio worksheet. Question 1 A. In an experiment, what is the difference between the response variable and the treatments? How can you identify which is which? B. In the experimental process, both random selection and random assignment occur. Explain the difference between random selection and random assignment. C. Why are random selection and random assignment important? Question 2 Researchers want to investigate whether people feel happier after exercising outside or exercising inside. Four hundred adults who already exercise regularly are randomly chosen to participate in the study. They are divided randomly into two groups. One group is asked to exercise inside at least five times a week, while the other group is asked to exercise outside at least five times a week. All participants are asked to rate their happiness on a scale of 1 to 10 at the end of each exercise session. At the end of the study, researchers compare the average happiness ratings of the outside exercise group to the average happiness ratings of the inside exercise group. A. What are the treatments in this experimental study? B. What is the response variable in this experimental study? Cc. Where in this experiment does random selection occur? D. Why is random selection important in this study? In your explanation, give an example of how this experimental study could have been designed differently so that selection was not random. Why would this be a problem? E. Where in the experiment does random assignment occur? F. Why is random assignment important in this study? In your explanation, give an example of how this experimental study could have been designed differently where assignment was not random. Why would this be a problem? Question 3 Suppose you believe that a specific type of plant will grow better in soil than in sand. You want to run an experiment to test your hypothesis. A. Describe an experiment you could run to investigate whether a specific type of plant grows better in soil than in sand. B. What are the treatments in your experiment? C. What is the response variable in your experiment? D. Where in your experiment would random selection occur? E. Where in your experiment would random assignment occur? Question 4 A randomly selected group of 20 teenagers were each given the same book and asked to read for 30 minutes. The control group read in silence, while the experimental group read while listening to loud music. The number of pages each teenager read was recorded. The results of the whole group are as follows. Number of pages read: {12, 15, 20, 25, 26, 26, 28, 29, 29, 30, 30, 31, 31, 31, 32, 32, 34, 35, 38, 40} The data has a mean of 28.7 and a range of 28. The data is then randomly assigned to two groups as follows. A. Find the mean for both Group A and Group B. Discuss how the means of each group compare to the mean of the data as a whole, and would these observations be the same for any random sampling of the data. B. Find the range for both Group A and Group B. Discuss how the ranges of each group compare to the range of the data as a whole, and would these observations be the same for any random sampling of the data. Question 5 You have proceeded with your experiment from Question 3 and are testing whether a specific type of plant grows better in soil than in sand. You record the heights of your plants weekly. After eight weeks, you compare the results. You find that the average difference in the heights of the plants in soil versus the plants in sand was 4.2 centimeters. You then generate a simulation of 96 more trials and create the following histogram of the differences. Histogram Difference in 40 Height (count) a0 Frequency Ss A. Do the data and the simulation provide evidence that this type of plant grows better in soil than in sand? Explain. B. Suppose you had found that the average difference in heights of the plants in soil versus the plants in sand was 1.9 centimeters. In this case, would the data and the simulation provide evidence that this type of plant grows better in soil than in sand? Explain. Question 6 A farmer is trying out a new fertilizer that is supposed to increase the height of her tulips. The report by the manufacturer showed that the fertilizer increases a tulip's height by an average of 12 percent compared to tulips that do not receive fertilizer. To determine if this new fertilizer is effective, the farmer first measures the heights of a random sample of 40 of her tulip plants and finds that they have a mean height of 22 centimeters. She then randomly divides these 40 tulip plants into two groups. She gives only one group the fertilizer. The farmer observes that the average height of the tulips that received the fertilizer increased by 18 centimeters, while the average height of the tulips that did not receive fertilizer increased by 13 centimeters. To test if the observed difference is statistically significant, the farmer re-randomized the tulip groups 50 times to account for the random differences in mean heights of her samples. The results of the farmer's simulation are represented in a dot plot (not shown). Describe how you could use the dot plot to determine whether the farmer's simulation supports the manufacturer's claim that the fertilizer increases a flower's height by an average of 12 percent
Step by Step Solution
There are 3 Steps involved in it
1 Expert Approved Answer
Step: 1 Unlock
Question Has Been Solved by an Expert!
Get step-by-step solutions from verified subject matter experts
Step: 2 Unlock
Step: 3 Unlock
Students Have Also Explored These Related Accounting Questions!