

Question: Condensed balance sheet and income statement data for Jergan Corporation are presented here. Jergan Corporation Balance Sheets December 31 2020 2019 2018 Cash $ 30,000
Condensed balance sheet and income statement data for Jergan Corporation are presented here.
| Jergan Corporation Balance Sheets December 31 | |||||||||
| 2020 | 2019 | 2018 | |||||||
| Cash | $ 30,000 | $ 16,600 | $ 18,700 | ||||||
| Accounts receivable (net) | 49,900 | 44,600 | 47,400 | ||||||
| Other current assets | 90,800 | 94,500 | 64,100 | ||||||
| Investments | 55,400 | 69,800 | 44,600 | ||||||
| Plant and equipment (net) | 500,100 | 370,700 | 357,700 | ||||||
| $726,200 | $596,200 | $532,500 | |||||||
| Current liabilities | $84,500 | $79,200 | $69,800 | ||||||
| Long-term debt | 144,900 | 84,800 | 50,500 | ||||||
| Common stock, $10 par | 369,000 | 312,000 | 315,000 | ||||||
| Retained earnings | 127,800 | 120,200 | 97,200 | ||||||
| $726,200 | $596,200 | $532,500 | |||||||
| Jergan Corporation Income Statement For the Years Ended December 31 | ||||||
| 2020 | 2019 | |||||
| Sales revenue | $737,000 | $605,200 | ||||
| Less: Sales returns and allowances | 39,200 | 29,100 | ||||
| Net sales | 697,800 | 576,100 | ||||
| Cost of goods sold | 426,100 | 366,000 | ||||
| Gross profit | 271,700 | 210,100 | ||||
| Operating expenses (including income taxes) | 187,964 | 152,490 | ||||
| Net income | $ 83,736 | $ 57,610 | ||||
Additional information:
| 1. | The market price of Jergans common stock was $7.00, $7.50, and $8.50 for 2018, 2019, and 2020, respectively. | |
| 2. | You must compute dividends paid. All dividends were paid in cash. |
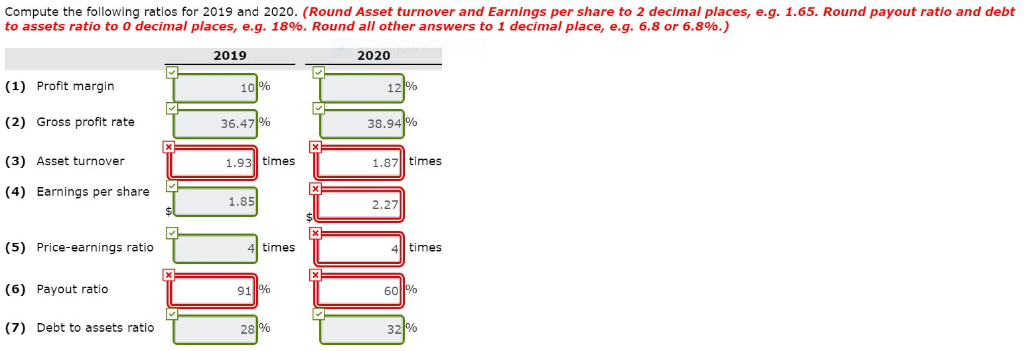
Compute the following ratios for 2019 and 2020. (Round Asset turnover and Earnings per share to 2 decimal places, e.g. 1.65. Round payout ratio and debt to assets ratio to 0 decimal places, e.g. 18%. Round all other answers to 1 decimal place, e.g. 6.8 or 6.8%.) 2019 2020 (1) Profit margin (2) Gross profit rate36.4 (3) Asset turnover (4) Earnings per share 10 12 38.94 020m 1.93 times 1.87 times 1.85 2.27 (5) Price-earnings ratio (6) Payout ratio (7) Debt to assets ratio 4 times 4 times 91 60% 281% 32
Step by Step Solution
There are 3 Steps involved in it

Get step-by-step solutions from verified subject matter experts