

Question: Conduct a 10-year general analysis based on the balance sheet.This company is a retail company like Walmart etc.Your analysis should be 2 paragraphs. CONSOLIDATED BALANCE
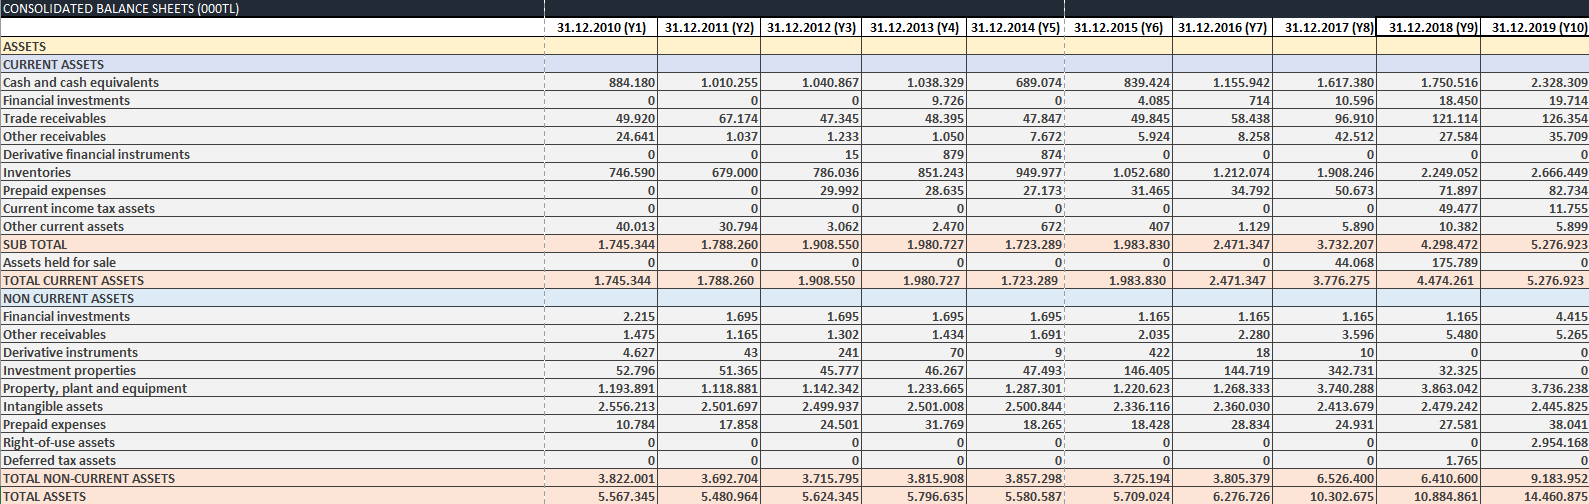
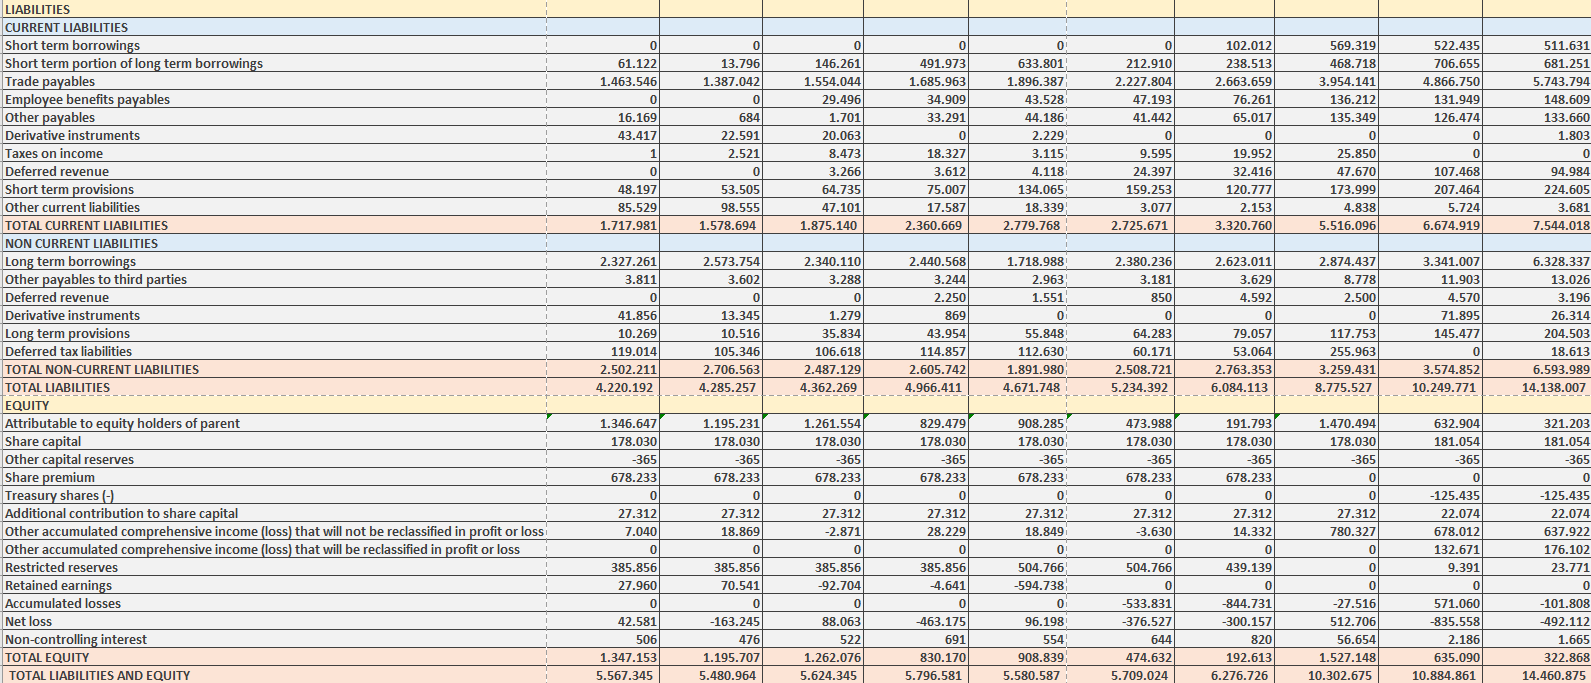 Conduct a 10-year general analysis based on the balance sheet.This company is a retail company like Walmart etc.Your analysis should be 2 paragraphs.
CONSOLIDATED BALANCE SHEETS (000TL) 31.12.2010 (Y1) 31.12.2011 (Y2) 31.12.2012 (Y3) 31.12.2013 (Y4) 31.12.2014 (Y5) 31.12.2015 (96) 31.12.2016 (Y7) 31.12.2017 (Y8) 31.12.2018 (Y9) 31.12.2019 (410) 1.155.942 884.1801 ol 1.010.255 0 67.174 1.037 ASSETS CURRENT ASSETS Cash and cash equivalents Financial investments Trade receivables Other receivables Derivative financial instruments Inventories Prepaid expenses Current income tax assets Other current assets SUB TOTAL Assets held for sale TOTAL CURRENT ASSETS NON CURRENT ASSETS Financial investments Other receivables Derivative instruments Investment properties Property, plant and equipment Intangible assets Prepaid expenses Right-of-use assets Deferred tax assets TOTAL NON-CURRENT ASSETS TOTAL ASSETS 1.040.867 ol 47.345 1.233 151 786.036 29.992 ol 49.920 24.641 0 746.590 0 0 40.013 1.745.344 0 0 1.745.344 01 679.000 0 0 30.794) 1.788.260 0 0 1.788.260 1.038.329 9.726 48.395 1.050 879 851.243 28.635 0 2.470 1.980.727 0 1.980.727 689.074 0 47.847 7.672 874 949.977 27.173 0 672 1.723.289 0 1.723.289 839.424) 4.085 49.845 5.924 0 1.052.680 31.465 0 0 407 1.983.830 0 1.983.830 714 58.438 8.258 0 1.212.074 34.792 ol 1.129 2.471.347 o 2.471.347 1.617.380 10.596 96.910 42.512 0 1.908.246 50.673 0 5.890 3.732.207 44.068 3.776.275 1.750.516 18.450 121.114 27.584 0 2.249.052 71.897 49.477 10.382 4.298.472 175.789 4.474.261 2.328.309 19.714 126.354 35.709 0 2.666.449 82.734 11.755 5.899 5.276.923 0 5.276.923 3.062 1.908.550 0 1.908.550 2.215 1.475 4.627 52.796 1.193.891 2.556.213 10.784 1.695 1.165 43 51.365 1.118.881 2.501.697 17.858 0 0 3.692.704 5.480.964 1.695 1.302 241 45.777 1.142.342 2.499.937 24.501 01 01 3.715.795 5.624.345 1.695 1.434 70 46.267 1.233.665 2.501.008 31.769 0 0 3.815.908 5.796.635 1.695 1.691 9 47.493 1.287.301 2.500.844 18.265 0 0 3.857.298 5.580.587 1.165 2.035 422 146.405 1.220.623 2.336.116 18.428 0 1.165 2.280 18 144.719 1.268.333 2.360.030 28.834 01 ol 3.805.379 6.276.726 1.165 3.596 10 342.731 3.740.288 2.413.679 24.931 1.165 5.480 0 32.325 3.863.042 2.479.242 27.581 ol 1.765 6.410.600 10.884.861 4.415 5.265 0 0 3.736.238 2.445.825 38.041 2.954.168 O 9.183.952 14.460.875 0 0 0 3.822.001 5.567.345 0 3.725.194 5.709.024 0 6.526.400 10.302.675 0 0 0 0 61.122 1.463.546 0 01 491.973 1.685.963 34.909 33.291 0 13.796 1.387.042 0 684 22.591 2.521 0 212.910 2.227.804 47.193 41.442 0 0 633.801 1.896.387 43.528 44.186 2.229 3.115 4.118 134.065 18.339 2.779.768 102.012 238.513 2.663.659 76.261 65.017 0 16.169 43.417 1 0 48.197 85.529 1.717.981 522.435 706.655 4.866.750 131.949 126.474) 0 146.261 1.554.044 29.496 1.701 20.063 8.473 3.266 64.735 47.101 1.875.140 569.319 468.718 3.954.141 136.212 135.349 0 25.850 47.670 173.999 4.838) 5.516.096 511.631 681.251 5.743.794 148.609 133.660 1.803 0 94.984 224.605 3.681 7.544.018 0 18.327 3.612 9.595 24.397 53.505 98.555 1.578.694 75.007 17.587 2.360.669 159.253 3.077 2.725.671 19.952 32.416) 120.777 2.153 3.320.7601 107.468 207.464 5.724 6.674.919 2.573.754 2.340.110 3.288 0 2.380.236 3.181 850 LIABILITIES CURRENT LIABILITIES Short term borrowings Short term portion of long term borrowings Trade payables Employee benefits payables Other payables Derivative instruments Taxes on income Deferred revenue Short term provisions Other current liabilities TOTAL CURRENT LIABILITIES NON CURRENT LIABILITIES Long term borrowings Other payables to third parties Deferred revenue Derivative instruments Long term provisions Deferred tax liabilities TOTAL NON-CURRENT LIABILITIES TOTAL LIABILITIES ---- EQUITY Attributable to equity holders of parent Share capital Other capital reserves Share premium Treasury shares (-) Additional contribution to share capital Other accumulated comprehensive income (loss) that will not be reclassified in profit or loss Other accumulated comprehensive income (loss) that will be reclassified in profit or loss Restricted reserves Retained earnings Accumulated losses Net loss Non-controlling interest TOTAL EQUITY TOTAL LIABILITIES AND EQUITY 0 2.327.261 3.811 0 41.856 10.269 119.014 2.502.211 4.220.192 3.602 ol 13.345 10.516 105.346) 2.706.563 4.285.257 1.718.988 2.963 1.551 0 55.848 112.630 2.440.568 3.244 2.250 869 43.954 114.857 2.605.742 4.966.411 1.279 35.834 106.618 2.487.129 4.362.269 2.623.011 3.629 4.592 0 79.057 53.064 2.763.353 6.084.113 2.874.437 8.778) 2.500 0 117.753 255.963 3.259.431 8.775.527 3.341.007 11.903 4.570 71.895 145.477 0 3.574.852 10.249.771 6.328.337 13.026 3.196 26.314 204.503 18.613 6.593.989 14.138.007 64.283 60.171 2.508.721 5.234.392 1.891.980 4.671.748 --- 191.793 1.346.647 178.030 -365 473.988 178.030 -365 678.233 0 829.479 178.030 -365 678.233 0 27.312 28.229 1.470.494 178.030 -365 0 678.233 0 27.312 7.040 0 385.856 27.960 1.195.231 178.030 -365 678.233 0 27.312 18.869 0 385.856 70.541 0 -163.245 476 1.195.707 5.480.964 1.261.5541 178.030 -365 678.233 01 27.312 -2.871 0 385.856 -92.704 0 908.285 178.030 -365 678.233 0 27.312 18.849 0 504.766 -594.738 0 0 27.312 780.327 0 0 0 385.856 -4.641 0 178.030 -365 678.233 0 0 27.312 14.3321 0 439.139 ol -844.731 -300.157 820 192.613 6.276.726 27.312 -3.630 0 504.766 0 -533.831 -376.527 644 474.632 5.709.024 632.904 181.054 -365 0 -125.435 22.074 678.012 132.671 9.391 0 571.060 -835.558 2.186 635.090 10.884.861 321.203 181.054 -365 0 -125.435 22.074 637.922 176.102 23.771 0 -101.808 -492.112 1.665 322.868 14.460.875 0 -463.175 691 42.581 506 1.347.153 5.567.345 88.063 522) 1.262.076 5.624.345 96.198 554 908.839 5.580.587 0 -27.516 512.706 56.654 1.527.148 10.302.675 830.170 5.796.581 CONSOLIDATED BALANCE SHEETS (000TL) 31.12.2010 (Y1) 31.12.2011 (Y2) 31.12.2012 (Y3) 31.12.2013 (Y4) 31.12.2014 (Y5) 31.12.2015 (96) 31.12.2016 (Y7) 31.12.2017 (Y8) 31.12.2018 (Y9) 31.12.2019 (410) 1.155.942 884.1801 ol 1.010.255 0 67.174 1.037 ASSETS CURRENT ASSETS Cash and cash equivalents Financial investments Trade receivables Other receivables Derivative financial instruments Inventories Prepaid expenses Current income tax assets Other current assets SUB TOTAL Assets held for sale TOTAL CURRENT ASSETS NON CURRENT ASSETS Financial investments Other receivables Derivative instruments Investment properties Property, plant and equipment Intangible assets Prepaid expenses Right-of-use assets Deferred tax assets TOTAL NON-CURRENT ASSETS TOTAL ASSETS 1.040.867 ol 47.345 1.233 151 786.036 29.992 ol 49.920 24.641 0 746.590 0 0 40.013 1.745.344 0 0 1.745.344 01 679.000 0 0 30.794) 1.788.260 0 0 1.788.260 1.038.329 9.726 48.395 1.050 879 851.243 28.635 0 2.470 1.980.727 0 1.980.727 689.074 0 47.847 7.672 874 949.977 27.173 0 672 1.723.289 0 1.723.289 839.424) 4.085 49.845 5.924 0 1.052.680 31.465 0 0 407 1.983.830 0 1.983.830 714 58.438 8.258 0 1.212.074 34.792 ol 1.129 2.471.347 o 2.471.347 1.617.380 10.596 96.910 42.512 0 1.908.246 50.673 0 5.890 3.732.207 44.068 3.776.275 1.750.516 18.450 121.114 27.584 0 2.249.052 71.897 49.477 10.382 4.298.472 175.789 4.474.261 2.328.309 19.714 126.354 35.709 0 2.666.449 82.734 11.755 5.899 5.276.923 0 5.276.923 3.062 1.908.550 0 1.908.550 2.215 1.475 4.627 52.796 1.193.891 2.556.213 10.784 1.695 1.165 43 51.365 1.118.881 2.501.697 17.858 0 0 3.692.704 5.480.964 1.695 1.302 241 45.777 1.142.342 2.499.937 24.501 01 01 3.715.795 5.624.345 1.695 1.434 70 46.267 1.233.665 2.501.008 31.769 0 0 3.815.908 5.796.635 1.695 1.691 9 47.493 1.287.301 2.500.844 18.265 0 0 3.857.298 5.580.587 1.165 2.035 422 146.405 1.220.623 2.336.116 18.428 0 1.165 2.280 18 144.719 1.268.333 2.360.030 28.834 01 ol 3.805.379 6.276.726 1.165 3.596 10 342.731 3.740.288 2.413.679 24.931 1.165 5.480 0 32.325 3.863.042 2.479.242 27.581 ol 1.765 6.410.600 10.884.861 4.415 5.265 0 0 3.736.238 2.445.825 38.041 2.954.168 O 9.183.952 14.460.875 0 0 0 3.822.001 5.567.345 0 3.725.194 5.709.024 0 6.526.400 10.302.675 0 0 0 0 61.122 1.463.546 0 01 491.973 1.685.963 34.909 33.291 0 13.796 1.387.042 0 684 22.591 2.521 0 212.910 2.227.804 47.193 41.442 0 0 633.801 1.896.387 43.528 44.186 2.229 3.115 4.118 134.065 18.339 2.779.768 102.012 238.513 2.663.659 76.261 65.017 0 16.169 43.417 1 0 48.197 85.529 1.717.981 522.435 706.655 4.866.750 131.949 126.474) 0 146.261 1.554.044 29.496 1.701 20.063 8.473 3.266 64.735 47.101 1.875.140 569.319 468.718 3.954.141 136.212 135.349 0 25.850 47.670 173.999 4.838) 5.516.096 511.631 681.251 5.743.794 148.609 133.660 1.803 0 94.984 224.605 3.681 7.544.018 0 18.327 3.612 9.595 24.397 53.505 98.555 1.578.694 75.007 17.587 2.360.669 159.253 3.077 2.725.671 19.952 32.416) 120.777 2.153 3.320.7601 107.468 207.464 5.724 6.674.919 2.573.754 2.340.110 3.288 0 2.380.236 3.181 850 LIABILITIES CURRENT LIABILITIES Short term borrowings Short term portion of long term borrowings Trade payables Employee benefits payables Other payables Derivative instruments Taxes on income Deferred revenue Short term provisions Other current liabilities TOTAL CURRENT LIABILITIES NON CURRENT LIABILITIES Long term borrowings Other payables to third parties Deferred revenue Derivative instruments Long term provisions Deferred tax liabilities TOTAL NON-CURRENT LIABILITIES TOTAL LIABILITIES ---- EQUITY Attributable to equity holders of parent Share capital Other capital reserves Share premium Treasury shares (-) Additional contribution to share capital Other accumulated comprehensive income (loss) that will not be reclassified in profit or loss Other accumulated comprehensive income (loss) that will be reclassified in profit or loss Restricted reserves Retained earnings Accumulated losses Net loss Non-controlling interest TOTAL EQUITY TOTAL LIABILITIES AND EQUITY 0 2.327.261 3.811 0 41.856 10.269 119.014 2.502.211 4.220.192 3.602 ol 13.345 10.516 105.346) 2.706.563 4.285.257 1.718.988 2.963 1.551 0 55.848 112.630 2.440.568 3.244 2.250 869 43.954 114.857 2.605.742 4.966.411 1.279 35.834 106.618 2.487.129 4.362.269 2.623.011 3.629 4.592 0 79.057 53.064 2.763.353 6.084.113 2.874.437 8.778) 2.500 0 117.753 255.963 3.259.431 8.775.527 3.341.007 11.903 4.570 71.895 145.477 0 3.574.852 10.249.771 6.328.337 13.026 3.196 26.314 204.503 18.613 6.593.989 14.138.007 64.283 60.171 2.508.721 5.234.392 1.891.980 4.671.748 --- 191.793 1.346.647 178.030 -365 473.988 178.030 -365 678.233 0 829.479 178.030 -365 678.233 0 27.312 28.229 1.470.494 178.030 -365 0 678.233 0 27.312 7.040 0 385.856 27.960 1.195.231 178.030 -365 678.233 0 27.312 18.869 0 385.856 70.541 0 -163.245 476 1.195.707 5.480.964 1.261.5541 178.030 -365 678.233 01 27.312 -2.871 0 385.856 -92.704 0 908.285 178.030 -365 678.233 0 27.312 18.849 0 504.766 -594.738 0 0 27.312 780.327 0 0 0 385.856 -4.641 0 178.030 -365 678.233 0 0 27.312 14.3321 0 439.139 ol -844.731 -300.157 820 192.613 6.276.726 27.312 -3.630 0 504.766 0 -533.831 -376.527 644 474.632 5.709.024 632.904 181.054 -365 0 -125.435 22.074 678.012 132.671 9.391 0 571.060 -835.558 2.186 635.090 10.884.861 321.203 181.054 -365 0 -125.435 22.074 637.922 176.102 23.771 0 -101.808 -492.112 1.665 322.868 14.460.875 0 -463.175 691 42.581 506 1.347.153 5.567.345 88.063 522) 1.262.076 5.624.345 96.198 554 908.839 5.580.587 0 -27.516 512.706 56.654 1.527.148 10.302.675 830.170 5.796.581
Step by Step Solution
There are 3 Steps involved in it

Get step-by-step solutions from verified subject matter experts