

Question: Conduct a financial analysis for LVHM for 2012 - 2015 using any six of the following financial ratios: current ratio, return on equity, return on
Conduct a financial analysis for LVHM for 2012 - 2015 using any six of the following financial ratios: current ratio, return on equity, return on assets, operating profit margin, coverage ratio, net profit margin, debt to assets, and debt to equity. Show your work. What is your assessment of LVHM financial performance.
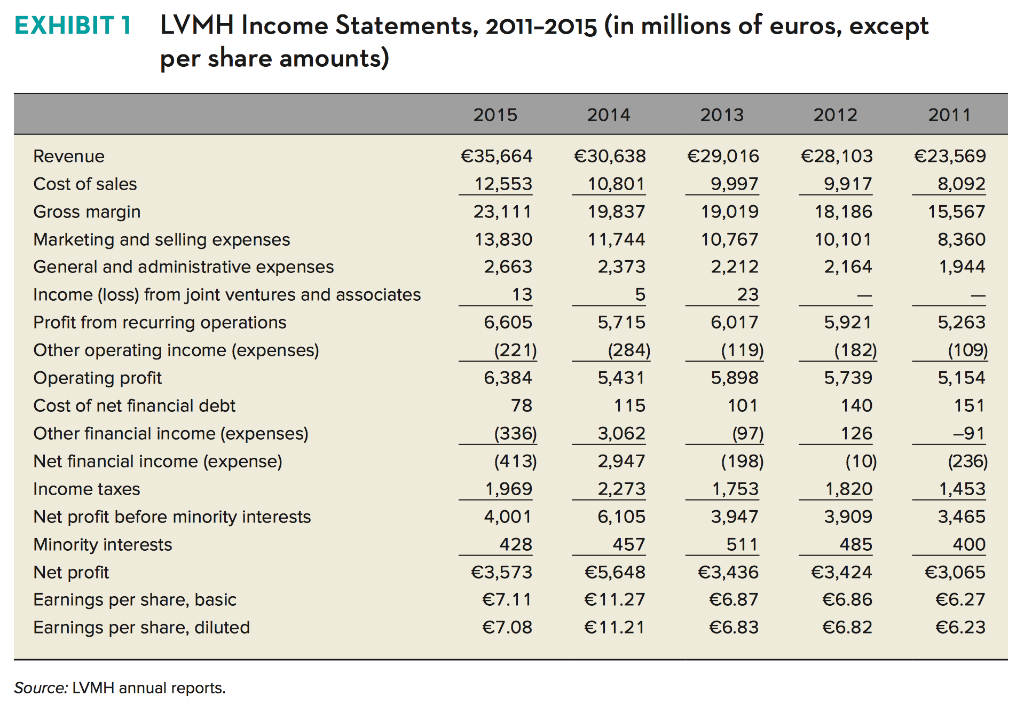
EXHIBIT I LVMH Income Statements, 2011-2015 (in millions of euros, except per share amounts) 2015 35,664 12,553 23,111 13,830 2,663 2014 30,638 10,801 19,837 11,744 2,373 2013 29,016 9,997 19,019 10,767 2,212 2012 28,103 9,917 18,186 10,101 2,164 2011 23,569 8,092 15,567 8,360 1,944 13 23 Revenue Cost of sales Gross margin Marketing and selling expenses General and administrative expenses Income (loss) from joint ventures and associates Profit from recurring operations Other operating income (expenses) Operating profit Cost of net financial debt Other financial income (expenses) Net financial income (expense) Income taxes Net profit before minority interests Minority interests Net profit Earnings per share, basic Earnings per share, diluted 6,017 (119) 5,898 101 5,921 (182) 5,739 140 5,263 (109) 5,154 151 5,715 (284) 5,431 115 3,062 2,947 2,273 6,105 (97) 126 6,605 (221) 6,384 78 (336) (413) 1,969 4,001 428 3,573 7.11. 7.08 -91 (236) 1,453 3,465 457 (198) 1,753 3,947 511 3,436 6.87 6.83 (10) 1,820 3,909 485 3,424 6.86 6.82 400 5,648 11.27 11.21 3,065 6.27 6.23 Source: LVMH annual reports
Step by Step Solution
There are 3 Steps involved in it

Get step-by-step solutions from verified subject matter experts