

Question: Conduct a financial ratio analysis using the data in attached. How do the results reflect different strategies pursued by the four companies? Exhibit 2 Comparative
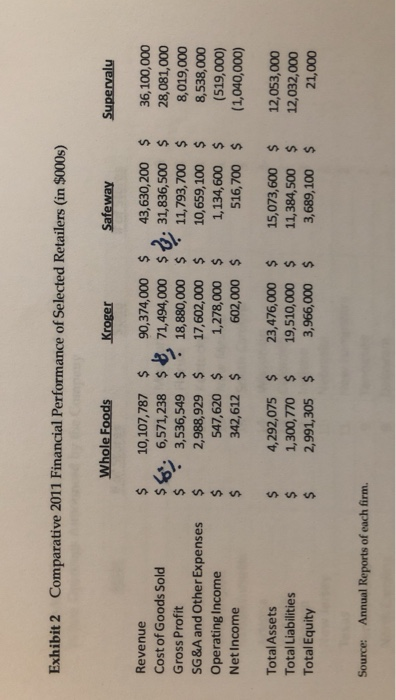
Exhibit 2 Comparative 2011 Financial Performance of Selected Retailers (in $000s) Whole Foods Kroger Safeway Revenue Cost of Goods Sold Gross Profit SG&A and Other Expenses2,988,929 Operating Income Net Income $10,107,787 $ 90,374,000 43,630,200$36,100,000 $6,6571,238 $71,494,000 $31,836,500 $ 28,081,000 3,536,549 18,880,000 $11,793,700 $ 8,019,000 8,538,000 547,620 1,278,000 1,134,600 (519,000) 342,612 602,000 $516,700 (1040,000) 17,602,000$10,659,100 Total Assets Total Liabilities Total Equity $ 4,292,075 23,476,000 15,073,600 $ 12,053,000 s 1,300,770 19,510,000 11,384500 $ 12,032,000 21,000 $ 2,991,305$ 3,966,000 $ 3,689,100$ Source: Annual Reports of each firm
Step by Step Solution
There are 3 Steps involved in it

Get step-by-step solutions from verified subject matter experts