

Question: Conduct a standard multiple regression to explore factors that impact on people's level of daytime sleepiness. a. DV: Sleepiness & Associated Sensations Scale total score
Conduct a standard multiple regression to explore factors that impact on people's level of daytime sleepiness.
a. DV: Sleepiness & Associated Sensations Scale total score (totSAS)
b. Predictors: sex, age, physical fitness rating (fitrate) and scores on HADS Depression Scale (depress),HADS Anxiety Score (anxiety), and general health (health rate)
- How much of the variance in total sleepiness scores is explained by the set of variables?
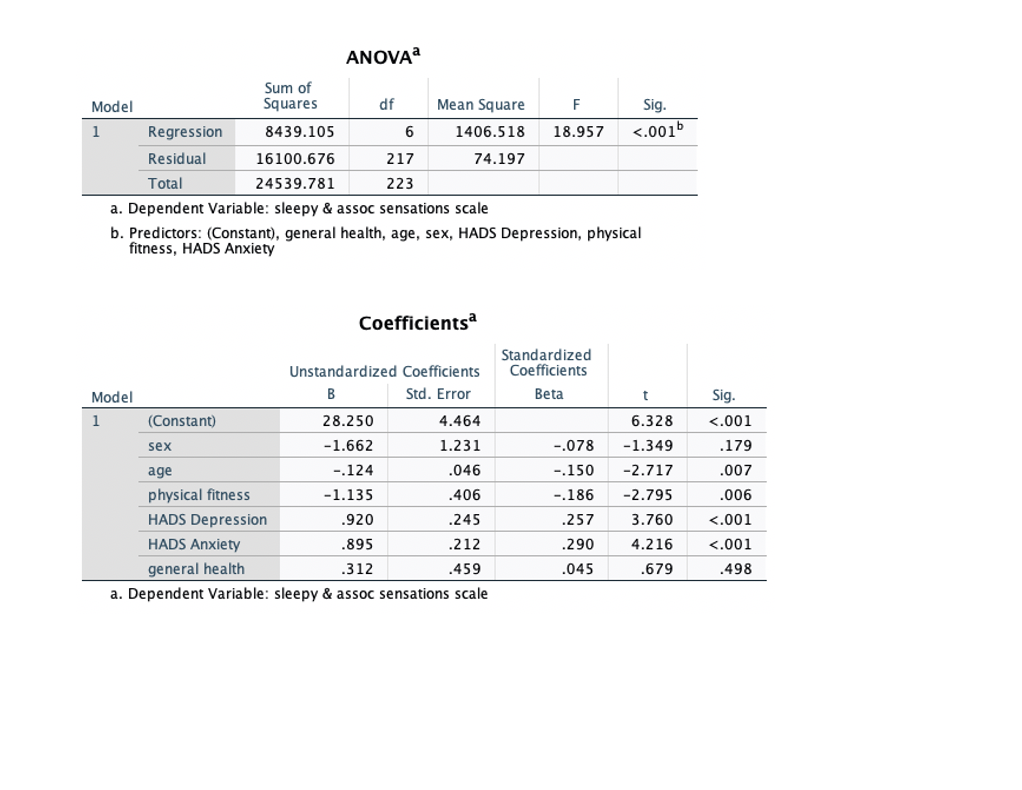
- Is the model statistically significant? Provide the results and an explanation of the results.
- What is the difference between the R2 and adjusted R2? Give the results and an explanation of what the different values mean.
- Which of the variables make a unique significant contribution?
- Which is strongest and what is its contribution?
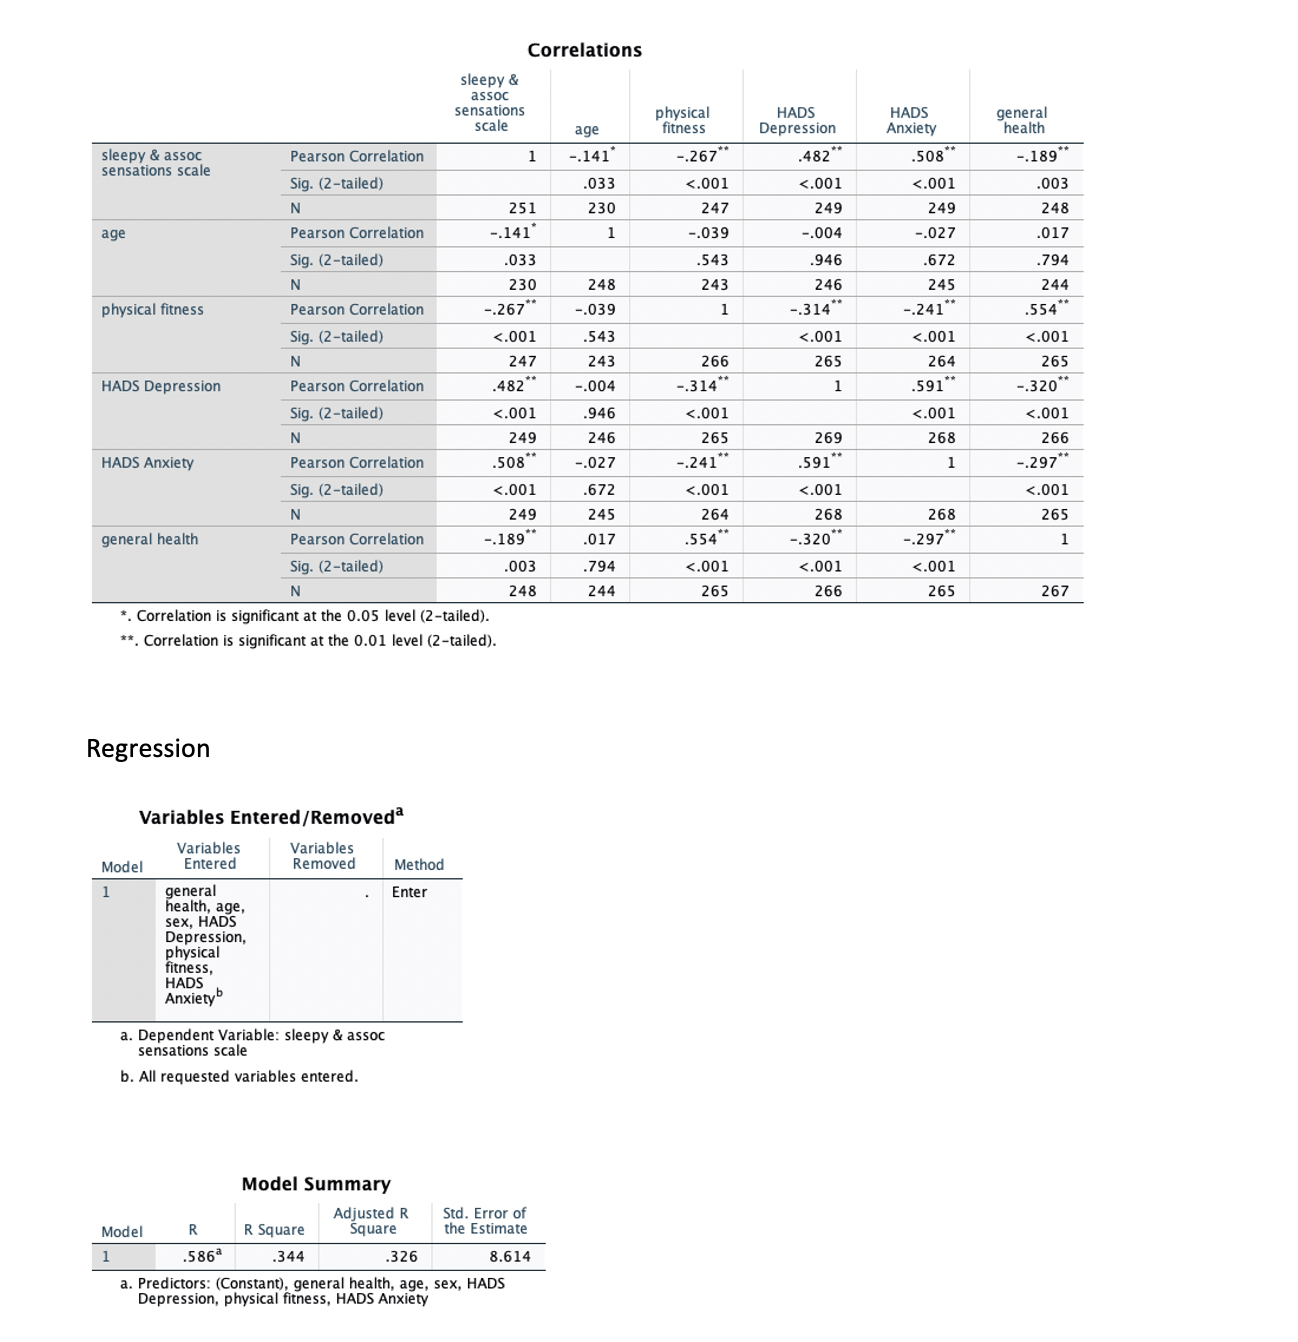
Correlations sleepy & assoc sensations physical HADS HADS general scale age fitness Depression Anxiety health sleepy & assoc Pearson Correlation -.141 -.267" 482 .508 -.189** sensations scale Sig. (2-tailed) .033 <.001 n age pearson correlation .141 .039 .004 sig. physical fitness .267 .241 hads depression ..004 .314 .320 anxiety .508 .297 general health .189 .003 .794 . is significant at the level regression variables entered model removed method enter sex a. dependent variable: sleepy assoc sensations scale b. all requested entered. summary adjusted r std. error of square estimate .586 .344 predictors: anxietyanova sum squares df mean f residual total coefficientsa standardized unstandardized coefficients b beta constant .290 .312 .045 .679 .498>
Step by Step Solution
There are 3 Steps involved in it

Get step-by-step solutions from verified subject matter experts