

Question: conduct appropriate statistical analyses of the data to draw conclusions for each research hypothesis. Write a brief report of the results in which you. ?
conduct appropriate statistical analyses of the data to draw conclusions for each research hypothesis. Write a brief report of the results in which you.
? Highlight all inferential statistical effects (e.g., There was a strong main effect of Factor A)
? Discuss the qualitative nature of any such effects (e.g., Group A scored higher on than group B)
? Report the results of your statistical tests using the appropriate formatting for each respective statistical test (e.g., t[12] = 2.53, p = .026, d = 0.74, 95% CI = [1.34, 4.78])
? Refer back to the research scenario to make a broad declarative statement about how well the research hypothesis is supported..
If you opt to use statistical software, please report exact p values for each statistical test (e.g., p = .026). Otherwise, if hand calculations, report p values in relation to (e.g., less than) the appropriate ?-level (e.g., ? = .05) and include the critical values from the relevant statistical tables provided in the textbook for each statistical test (e.g., p
Please help with this
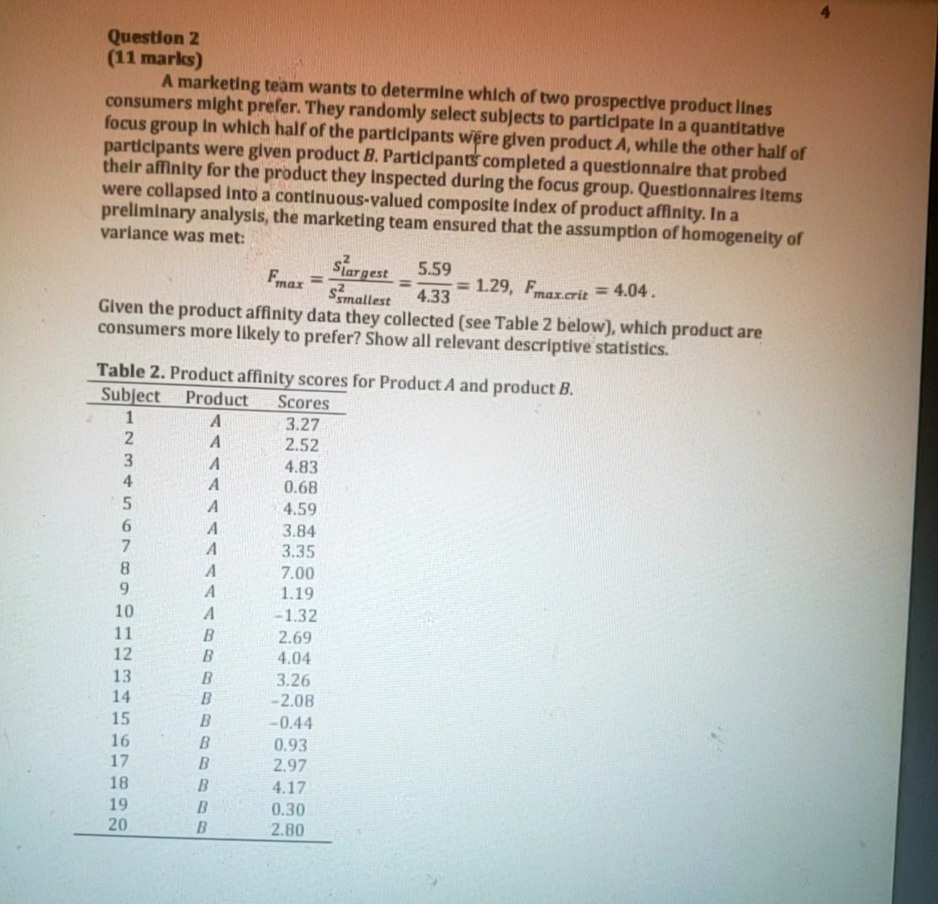
Question 2 (11 marks) A marketing team wants to determine which of two prospective product lines consumers might prefer. They randomly select subjects to participate In a quantitative focus group In which half of the participants were given product A, while the other half of participants were given product B. Participants completed a questionnaire that probed their affinity for the product they Inspected during the focus group. Questionnaires Items were collapsed Into a continuous-valued composite Index of product affinity. In a preliminary analysis, the marketing team ensured that the assumption of homogenelty of variance was met: Slargest 5.59 Fmars Ssmallest 4.33 129, Fmax.crit = 4.04. Given the product affinity data they collected (see Table 2 below), which product are consumers more likely to prefer? Show all relevant descriptive statistics. Table 2. Product affinity scores for Product A and product B. Subject Product Scores A 3.27 2.52 4.83 0.68 4.59 3.84 3.35 7.00 1.19 -1.32 2.69 4.04 3.26 -2.08 -0.44 0.93 2.97 4.17 0.30 2.80
Step by Step Solution
There are 3 Steps involved in it

Get step-by-step solutions from verified subject matter experts