Question: Conducting Sensitivity and Analysis and Mitigating Risk Pick at least two variables in the spreadsheet to flex by 5% up and down (for variables that
Conducting Sensitivity and Analysis and Mitigating Risk
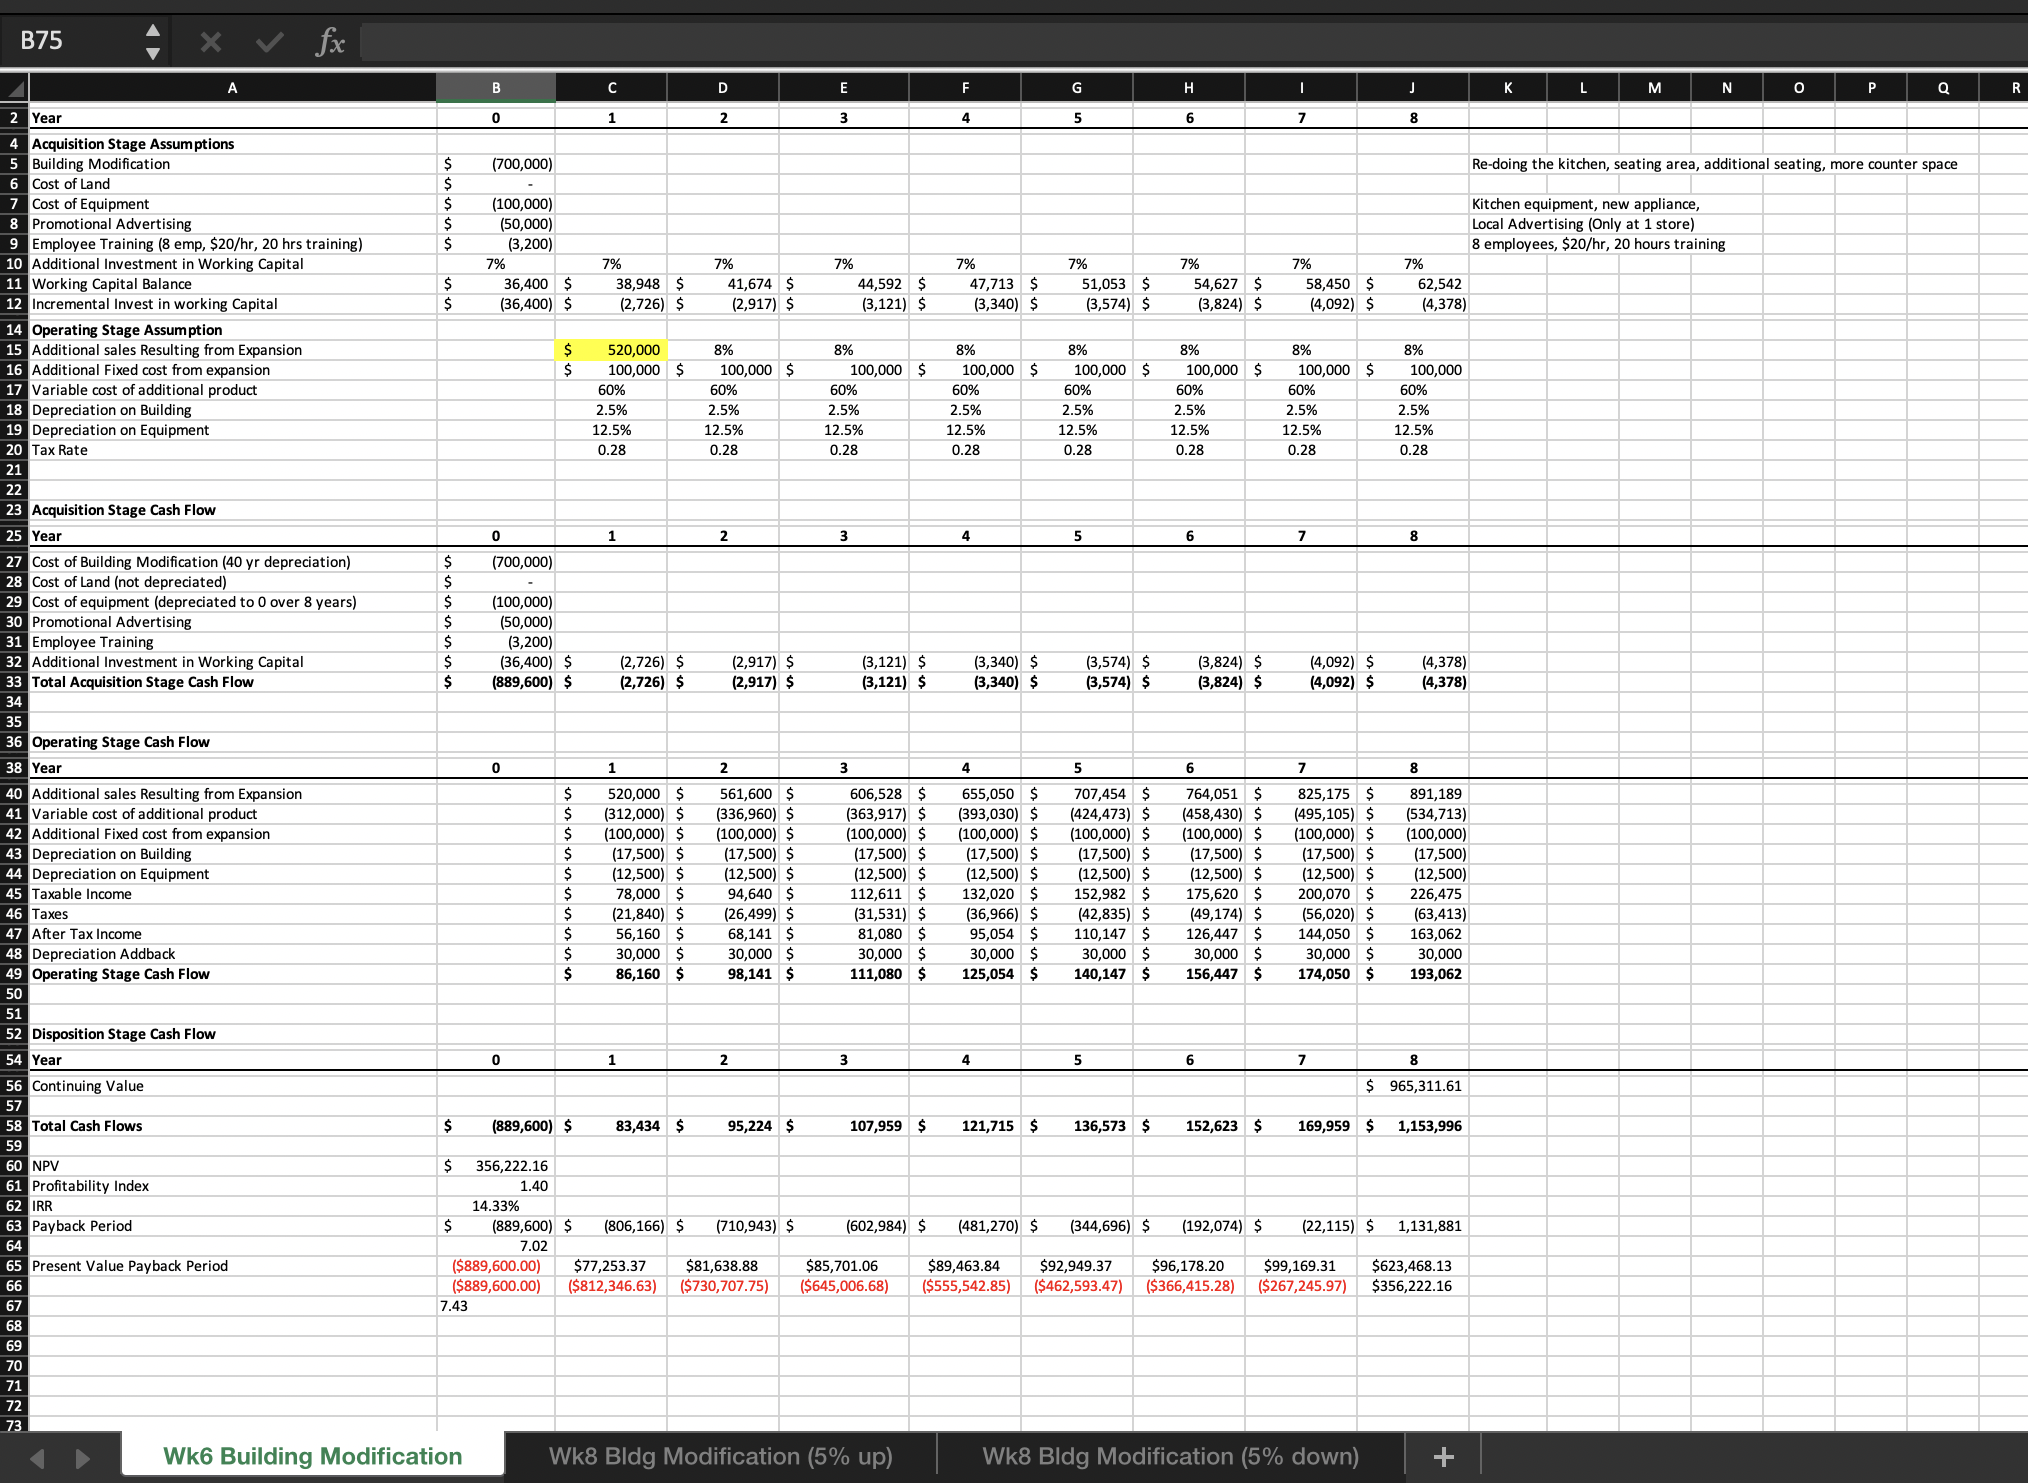
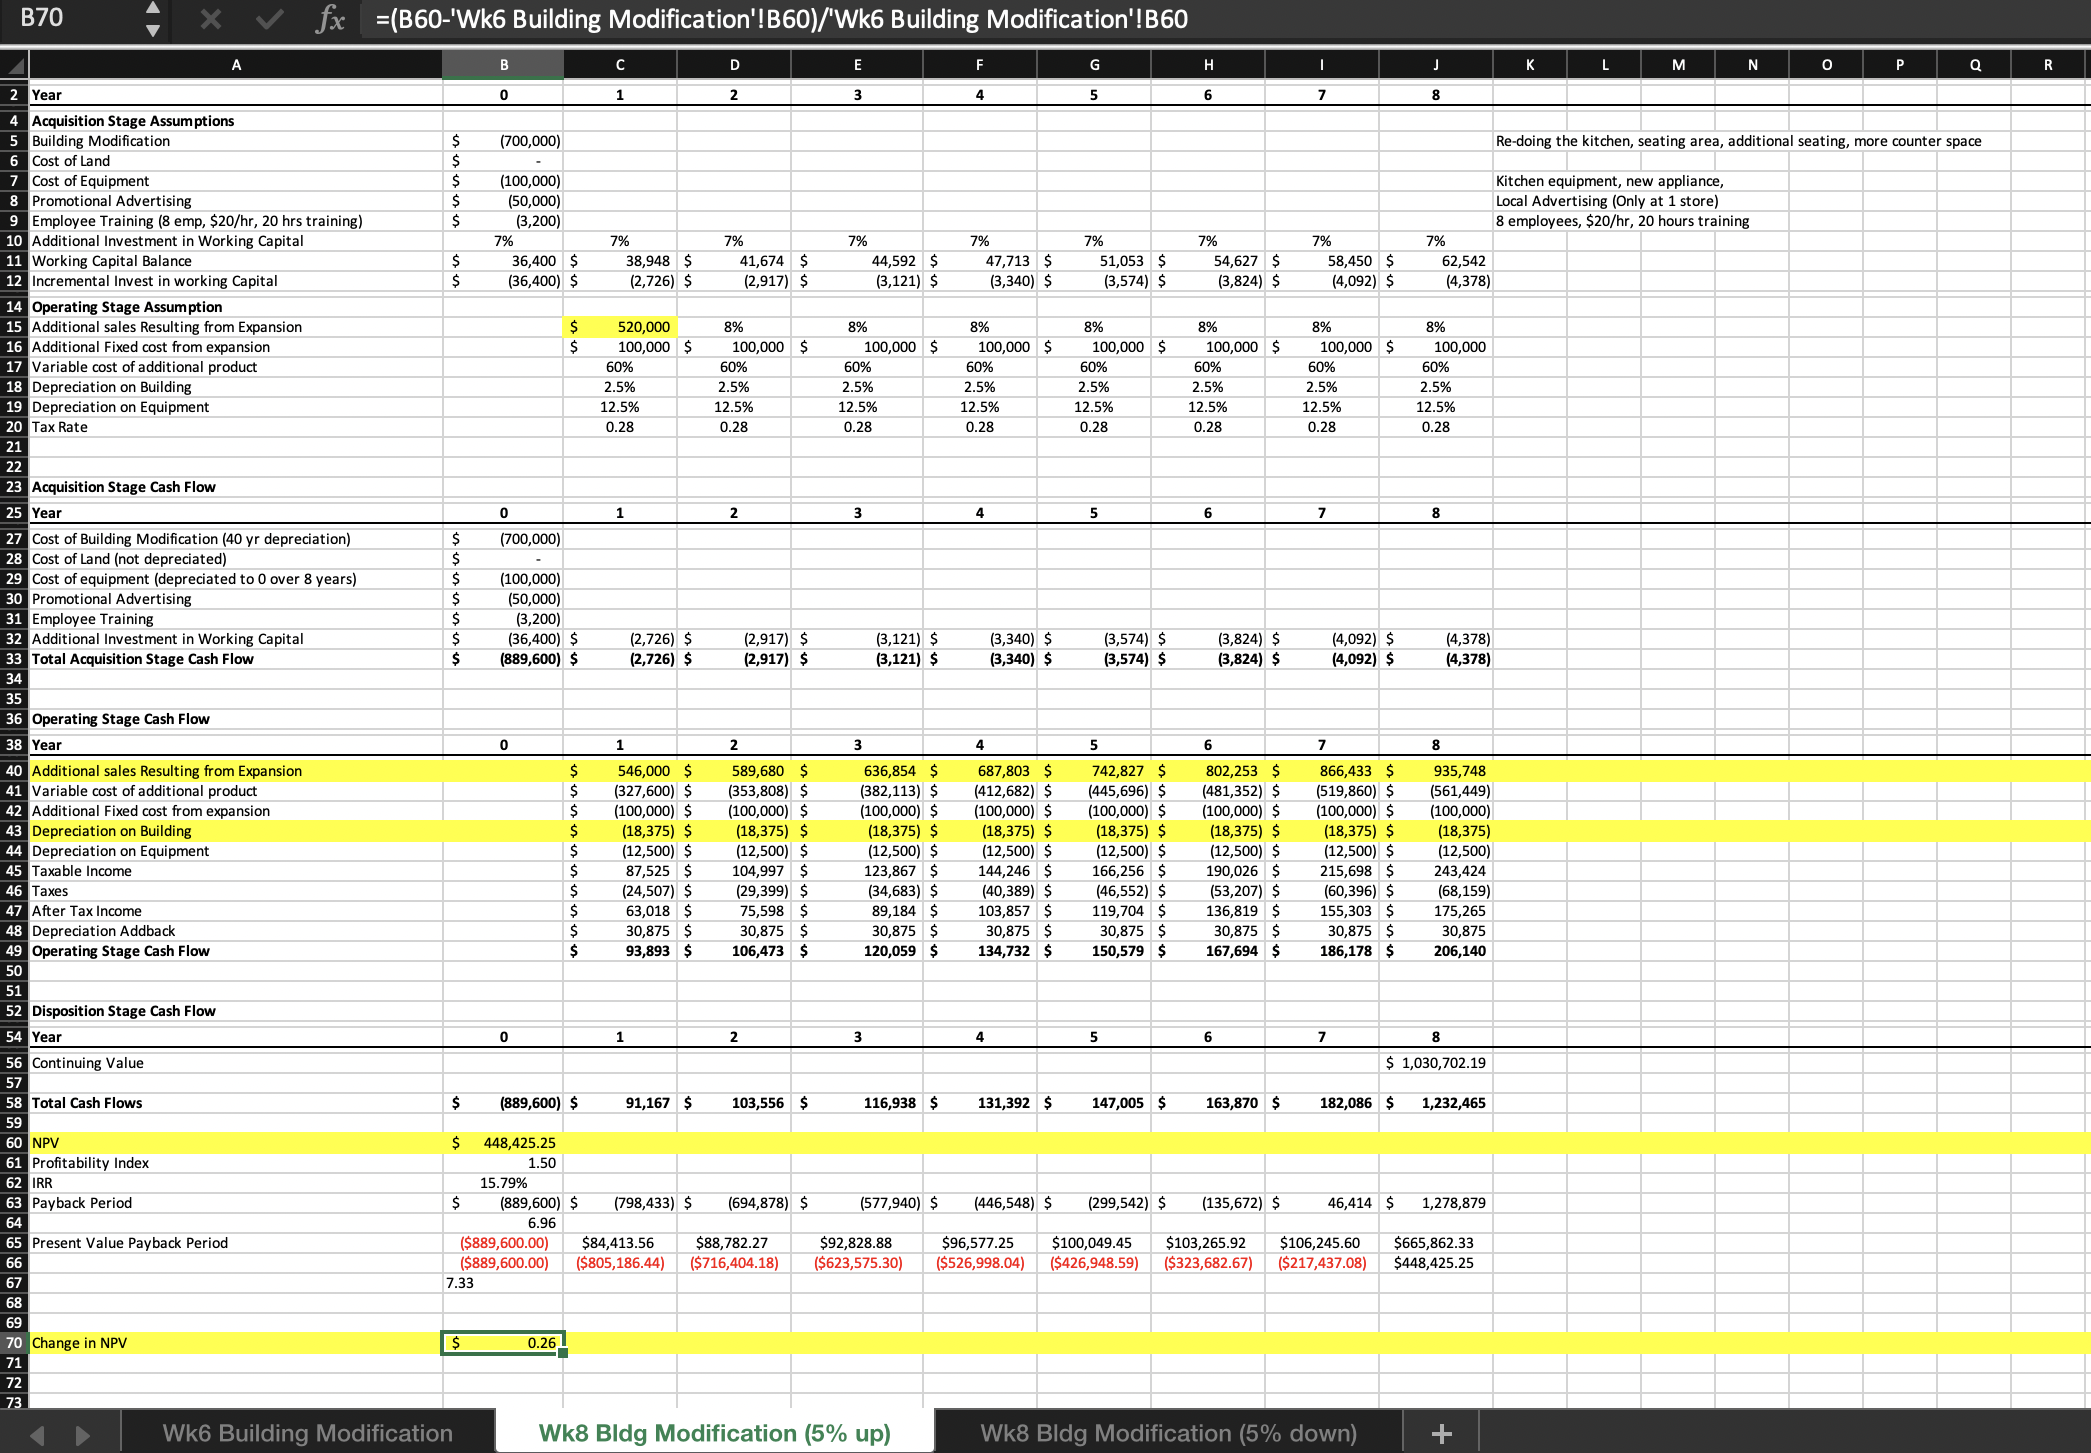
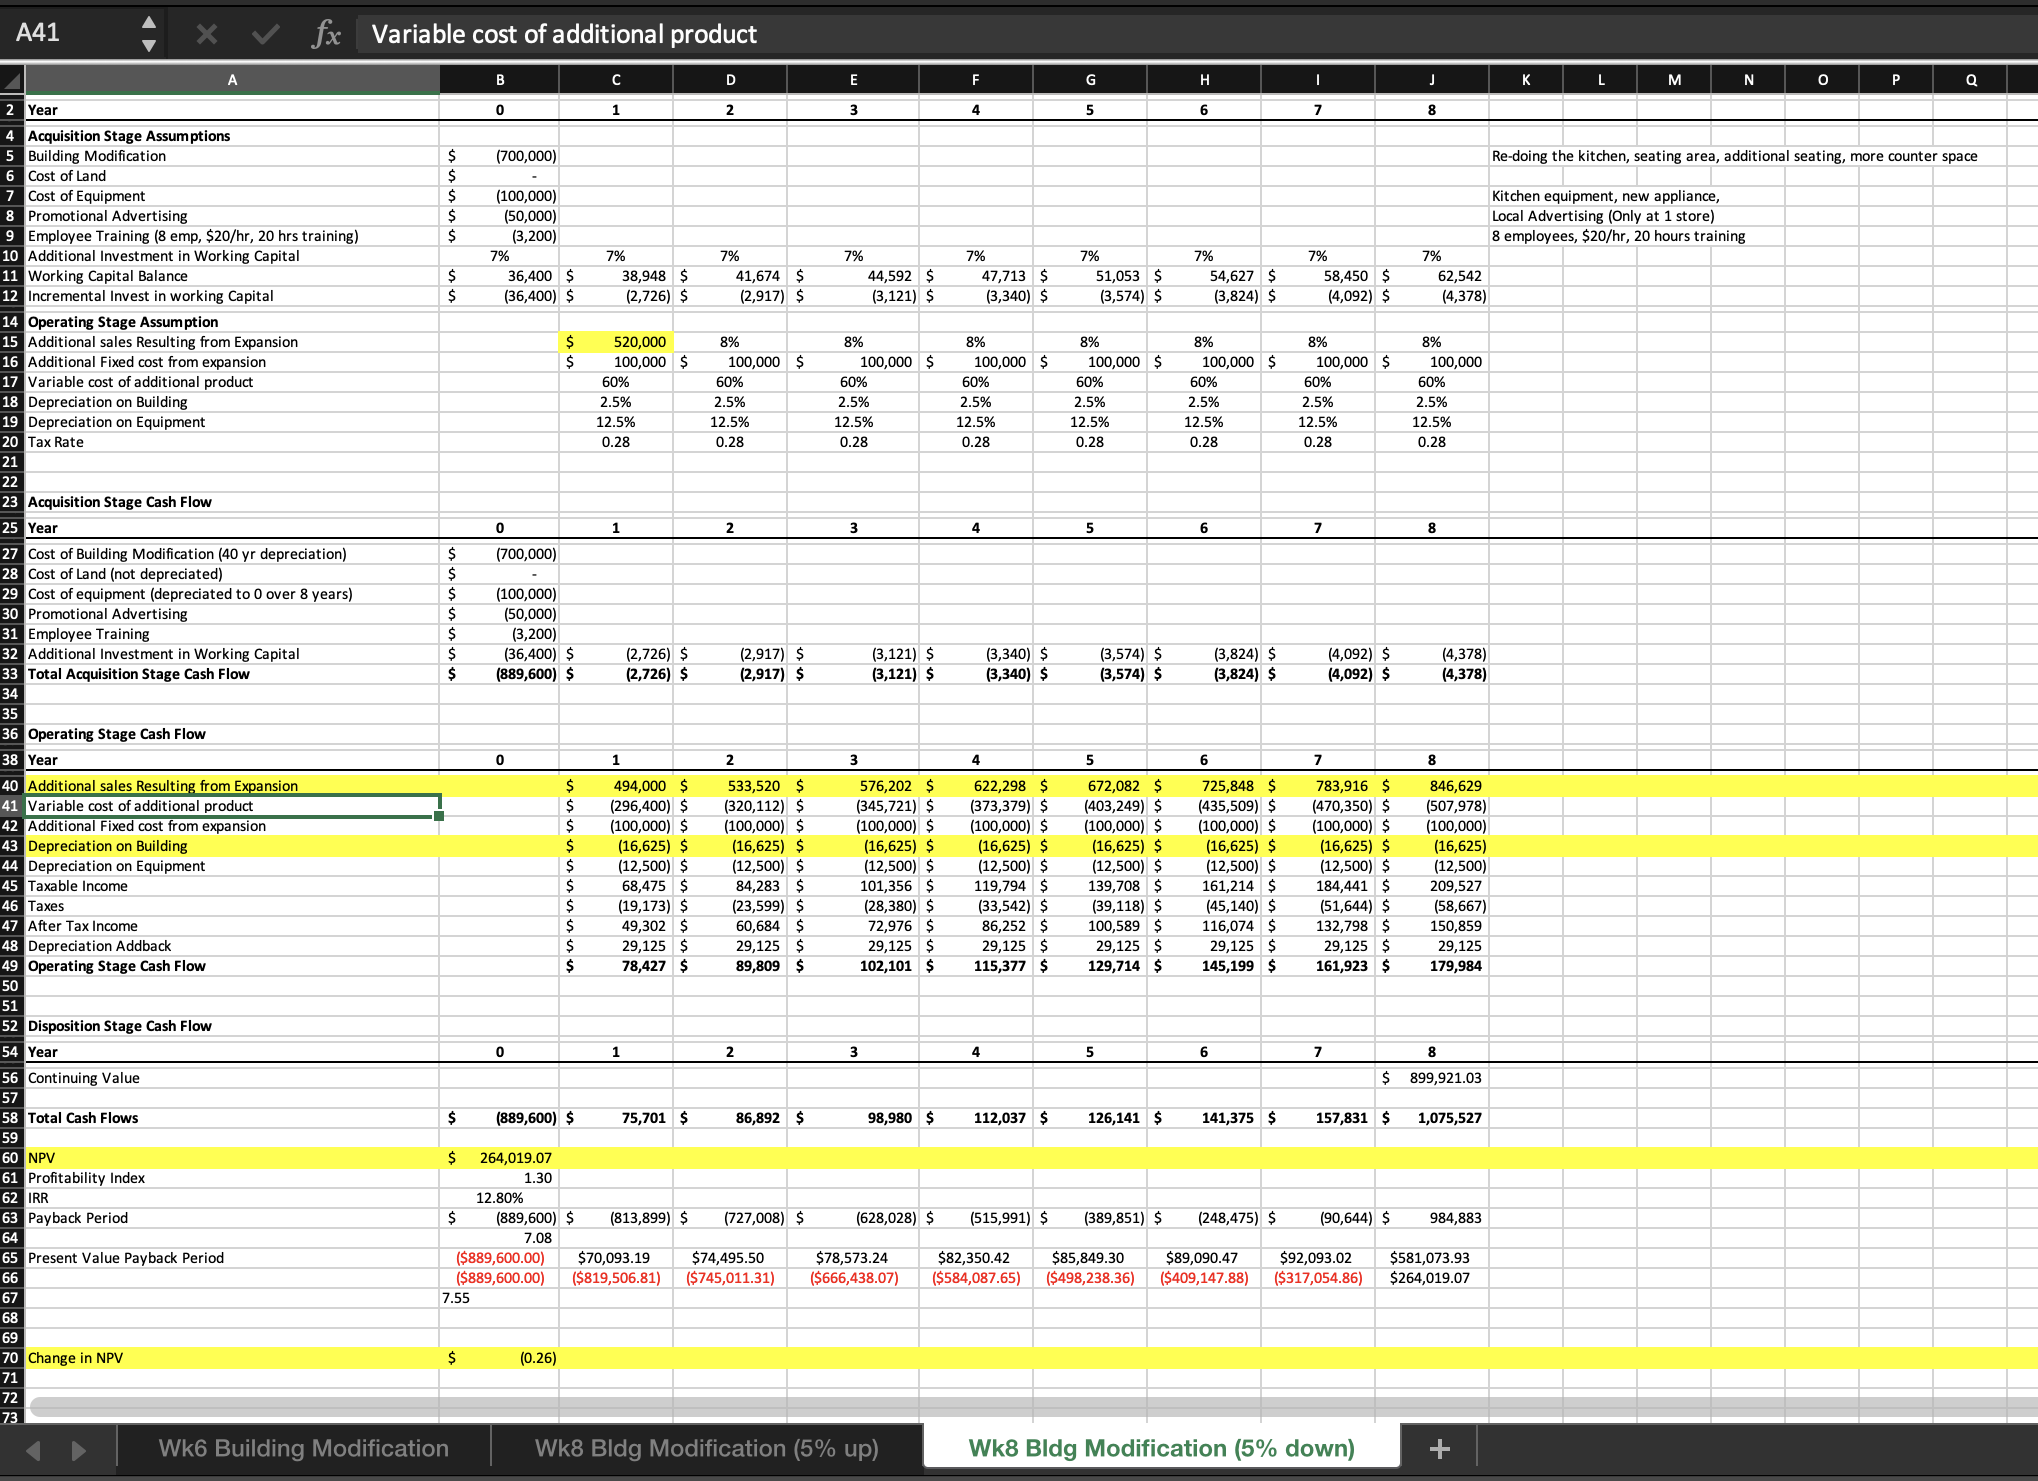
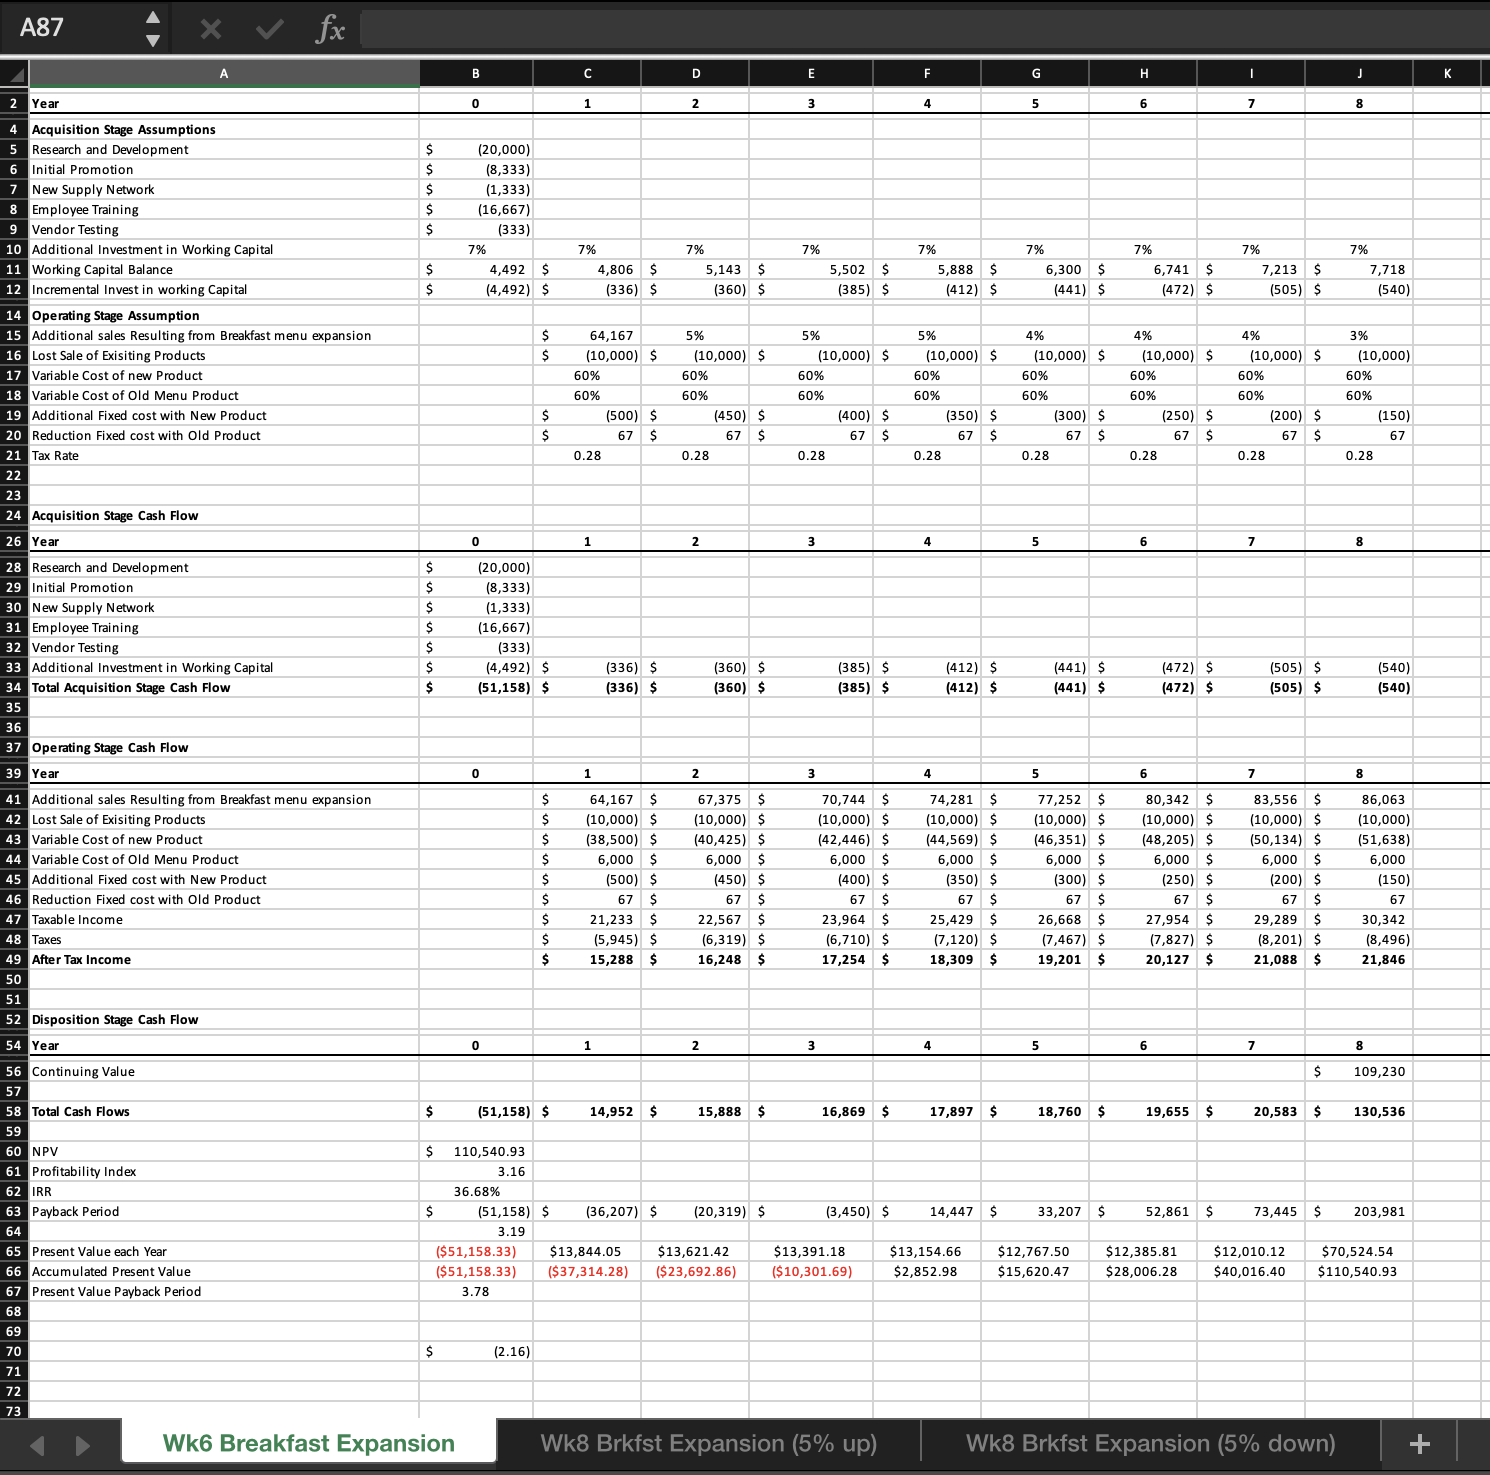
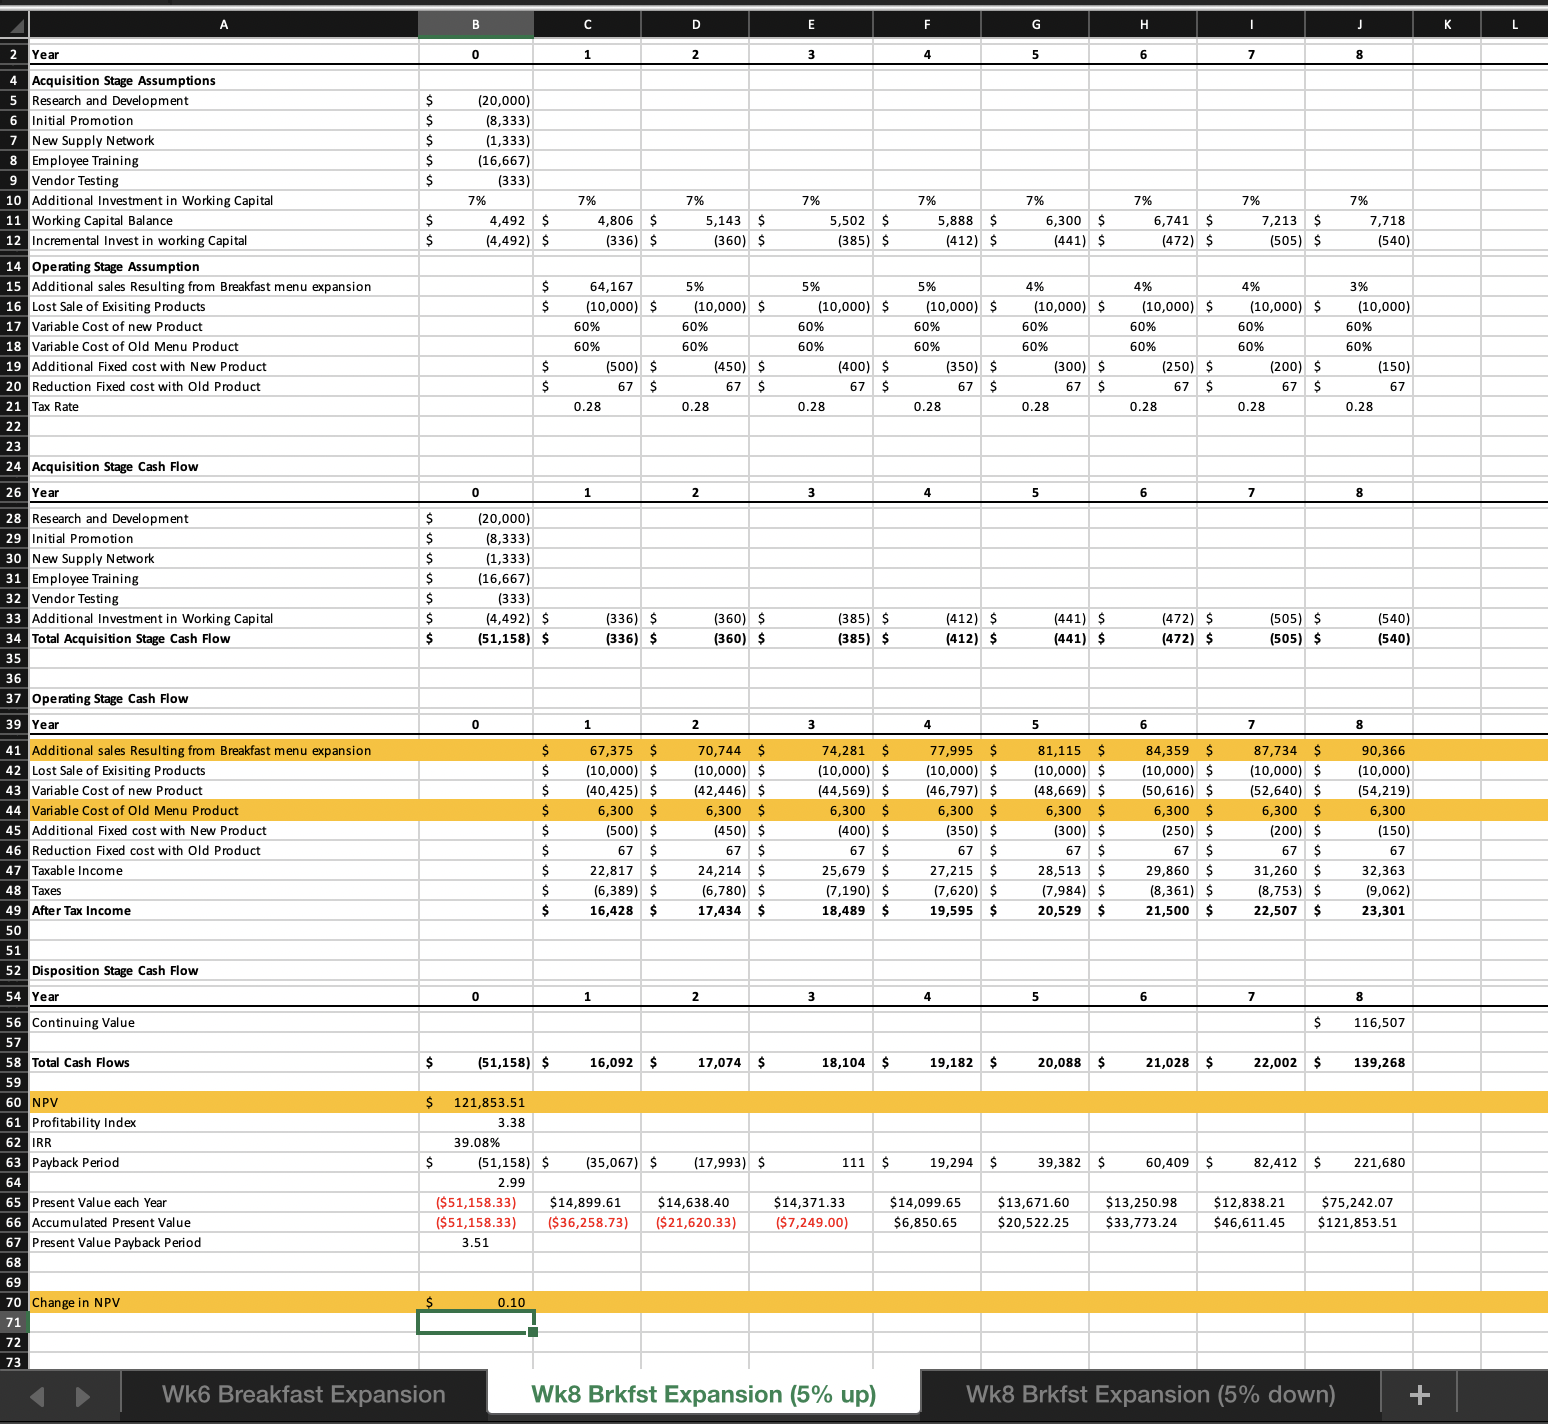
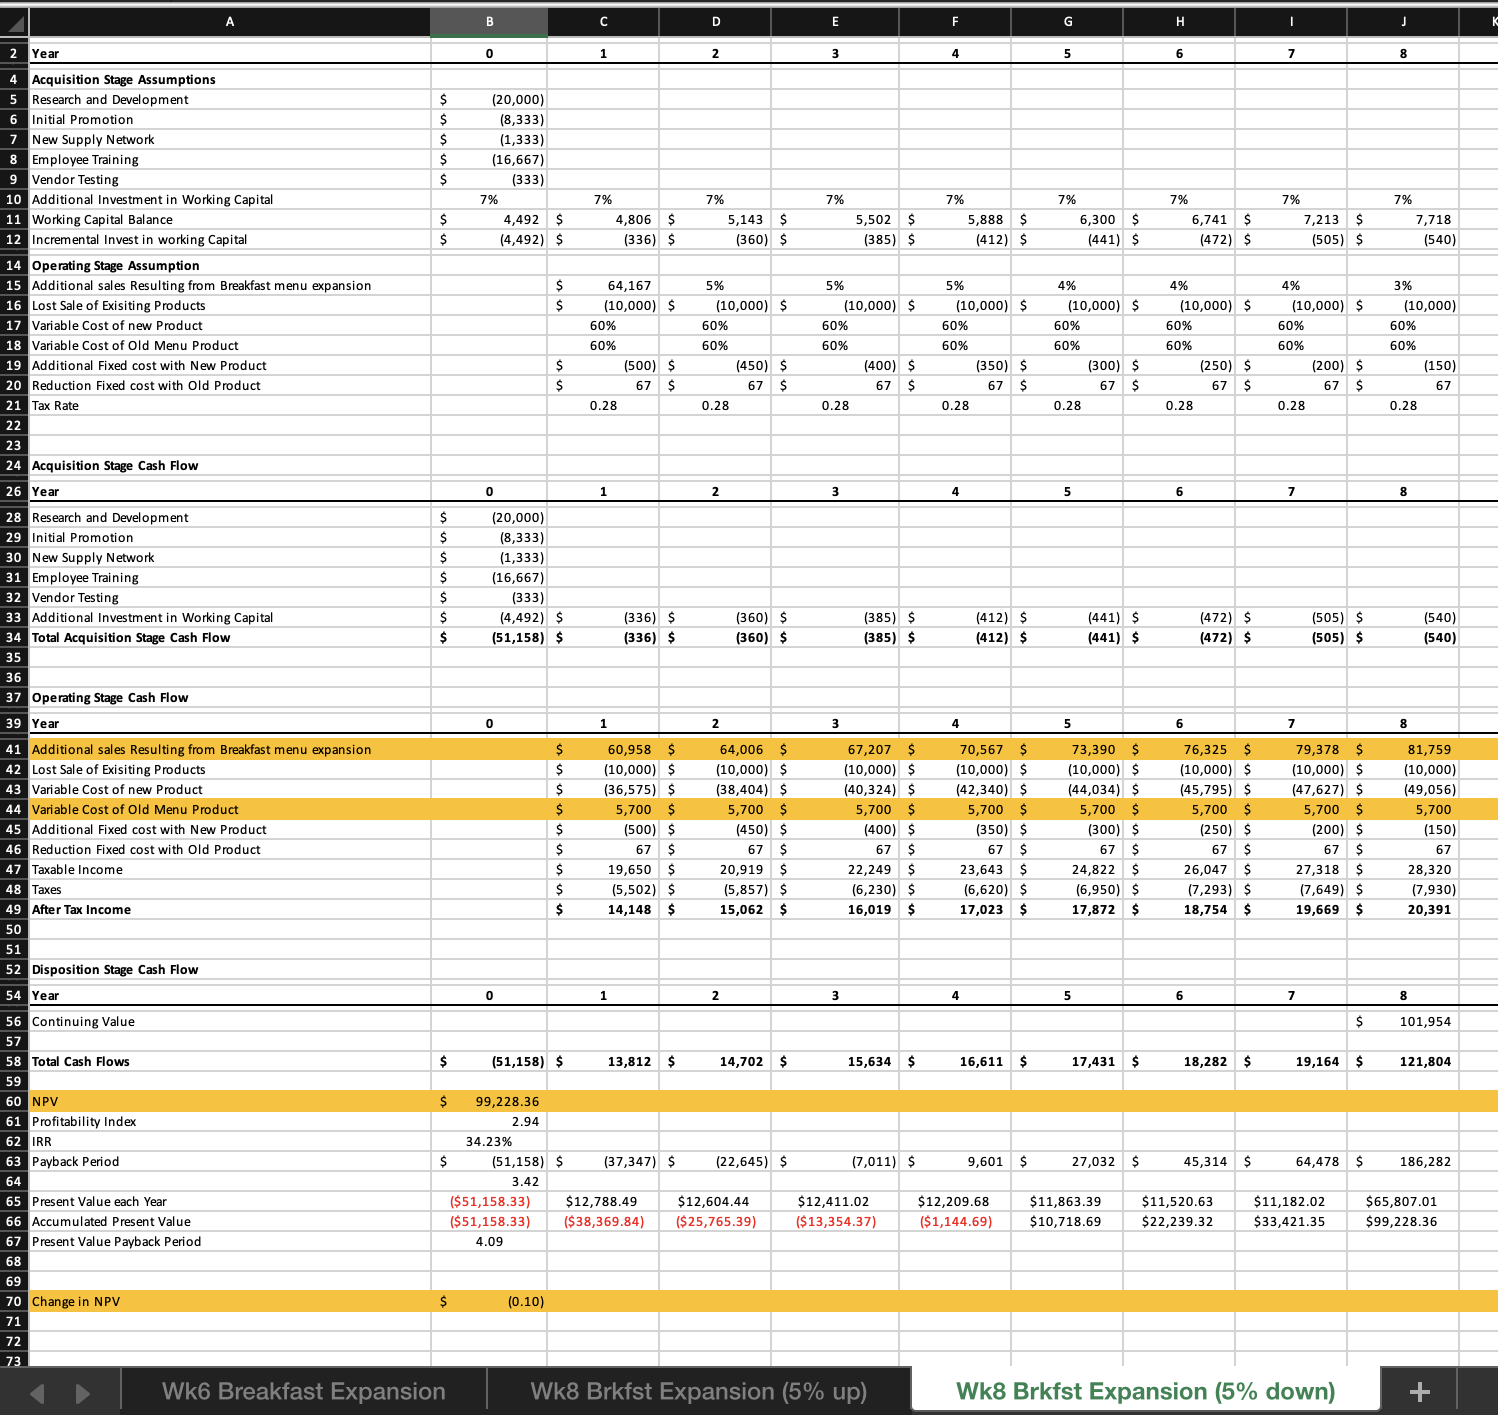
Pick at least two variables in the spreadsheet to "flex" by 5% up and down (for variables that cover more than one year please remember to change all years). Move these variables up 5% and recorded the new net present value. Take the difference between the new net present value and the original net present value and divide by the original net present value to get the percentage change in net present value. Record what you changed and the percentage change in net present value.
The part above is done,I'm attaching screenshots of it. I need help with the part below.
The 5% increase and decrease have been completed for both projects. I also calculated the percentage change in NPV. There are 4 highlighted rows on each of the four pages.
Use the paragraph to discuss the first variable that your team "flexed". Please describe the variable, the percentage change in the variable (if different than 5%), and the percentage change in the net present value as a result of the change. Remember to note if it is a decrease or increase in Net Present Value. Use an another paragraph to describe the projects sensitivity to the second variable. The next paragraphs should discuss two actions that your group believes management can do to mitigate the risk of this project.
B75 X V fx B C D E G H J M N P Q 2 Year 2 6 8 Acquisition Stage Assumptions Building Modification (700,000) Re-doing the kitchen, seating area, additional seating, more counter space Cost of Land Cost of Equipment 100,000 Kitchen equipment, new appliance Promotional Advertising (50,000) Local Advertising (Only at 1 store) Employee Training (8 emp, $20/hr, 20 hrs training) (3,200 employees, $20/hr, 20 hours training 10 Additional Investment in Working Capital 7% 7% 7% 7% 7% 1% 1% 7% 7% Working Capital Balance 36,400 $ 38,948 41,674 44,592 $ 47,713 51,053 $ 54,627 $ 58,450 $ 62,542 Incremental Invest in working Capital 36,400) $ (2,726) (2,917) (3,121) $ (3,340) $ (3,574) $ (3,824) $ (4,092) $ (4, 378 ) Operating Stage Assumption Additional sales Resulting from Expansion 520,000 8% 8% 3% 3% 8% 3% 8% Additional Fixed cost from expansion 100,000 $ 100,000 $ 100,000 $ 100,000 $ 100,000 $ 100,000 $ 100,000 $ 100,000 Variable cost of additional product 60% 60% 60% 50% 60% 60% 60% 60% 8 Depreciation on Building 2.5% 2.5% 2.5% 2.5% 2.59 2.5% 2.5% 2.5% Depreciation on Equipment 12.5% 12.5% 12.5% 12.5% 12.59% 12.5% 12.59 12.5% 20 Tax Rate 0.28 0.28 0.28 0.28 0.28 0.28 0.28 0.28 Acquisition Stage Cash Flow Year Cost of Building Modification (40 yr depreciation) (700,000 Cost of Land (not depreciated) Cost of equipment (depreciated to 0 over 8 years) 100,000 Promotional Advertising (50,000) Employee Training (3,200) Additional Investment in Working Capital (36,400) $ (2,726) (2,917) $ (3,121) $ (3,340) $ (3,574) $ (3,824) $ (4,092) $ (4,378) Total Acquisition Stage Cash Flow (889,600) $ (2,726) $ (2,917) $ (3,121) $ (3,340) $ (3,574) $ (3,824) $ (4,092) $ (4,378) Operating Stage Cash Flow Year 0 40 Additional sales Resulting from Expansion 520,000 561,600 $ 606,528 $ 655,050 $ 707,454 764,051 $ 825,175 $ 891,18 Variable cost of additional product 0) $ (336,960) $ 363,917) $ 393,030) $ (424,473) $ (458,430) $ (495,105) $ (534,713) Additional Fixed cost from expansion 100,000) $ (100,000) $ 100,000) $ (100,000) $ (100,000) $ (100,000) $ 100,000) $ (100,000) Depreciation on Building (17,500) $ (17,500) $ 17,500) $ 17,500) $ (17,500) $ (17,500) $ (17,500) $ (17,500) Depreciation on Equipment (12,500) $ (12,500) $ (12,500) $ (12,500) $ (12,500) $ (12,500) $ (12,500) $ (12,500) Taxable Income 78,000 94,640 $ 12,611 132,020 $ 2 $ 175,620 200,070 $ 226,475 46 Taxes (21,840) $ (26,499) $ (31,531) $ (36,966) $ (42,835) $ (49,174) $ (56,020) $ (63,413) After Tax Income 56,160 68,141 $ 81,080 $ 10,147 $ 26,447 $ 144,050 $ 163,062 Depreciation Addback 30,000 $ 30,000 $ 30,000 $ 30,000 $ 30,000 $ 30,000 $ 30,000 $ 30,000 Operating Stage Cash Flow 86,160 5 98 ,141 $ 111,080 5 125,054 5 140,147 5 156,447 5 174,050 5 193,062 Disposition Stage Cash Flow 4 Year 0 Continuing Value $ 965,311.61 Total Cash Flows $ (889,600) $ 83,434 $ 95 ,224 $ 107,959 $ 121,715 $ 136,573 $ 152,623 $ 169,959 $ 1,153,996 59 NPV $ 356,222.16 61 Profitability Index 1.40 62 IRR 14.33% Payback Period (889,600) $ (806,166) $ (710,943) $ (602,984) $ (481,270) $ (344,696) $ (192,074) $ (22,115) $ 1,131,881 7.02 Present Value Payback Period ($889,600.00) $77,253.37 $81,638.88 $85,701.06 $89,463.84 $92,949.37 $96,178.20 $99,169.31 $623,468.13 9 8 8 ($889,600.00) ($812,346.63) ($730,707.75) ($645,006.68) ($555,542.85) ($462,593.47) ($366,415.28) ($267,245.97) $356,222.16 7.43 Wk6 Building Modification Wk8 Bldg Modification (5% up) Wk8 Bldg Modification (5% down) +B70 V X V fx =(B60-'Wk6 Building Modification'! B60)/"Wk6 Building Modification'! B60 G H M 0 Q 2 Year 0 2 5 8 Acquisition Stage Assumptions Building Modification (700,000) Re-doing the kitchen, seating area, additional seating, more counter space Cost of Land Cost of Equipment (100,000 Kitchen equipment, new appliance, Promotional Advertising (50,000) Local Advertising (Only at 1 store Employee Training (8 emp, $20/hr, 20 hrs training) (3,200) 8 employees, $20/hr, 20 hours training Additional Investment in Working Capital 7% 7% 7% 7% 7% 7% 7% 7% 7% 11 Working Capital Balance 36,400 $ 38,948 $ 41,674 $ 44,592 $ 47,713 $ 51,053 $ 54,627 $ 58,450 $ 62,542 12 Incremental Invest in working Capital 36,400) $ (2,726) $ (2,917) $ (3,121) $ (3,340) $ (3,574) $ (3,824) $ (4,092) $ (4,378) 14 Operating Stage Assumption 15 Additional sales Resulting from Expansion S 520,000 3% 3% 3% 3% 8% 3% 8% 16 Additional Fixed cost from expansion 100,000 100,000 $ 100,000 $ 100,000 $ 100,000 $ 100,000 $ 100,000 $ 100,000 17 Variable cost of additional product 60% 60% 60% 60% 60% 60% 60% 60% 18 Depreciation on Building 2.5% 2.5% 2.5% 2.5% 2.59 2.5% 2.59 2.5% Depreciation on Equipment 12.5% 12.5% 12.5% 12.5% 12.5% 12.5% 12.5% 12.5% 20 Tax Rate 0.28 0.28 0.28 0.28 0.28 0.28 0.28 0.28 21 22 23 Acquisition Stage Cash Flow 0 2 27 Cost of Building Modification (40 yr depreciation) (700,000) Cost of Land (not depreciated) 29 Cost of equipment (depreciated to 0 over 8 years) (100,000 30 Promotional Advertising (50,000) Employee Training (3,200) 32 Additional Investment in Working Capital (36,400) $ (2, 726) $ (2,917) $ (3,121) $ (3,340) $ (3,574) $ (3,824) $ (4,092) $ (4,378) Total Acquisition Stage Cash Flow (889,600) $ 2,726) $ (2,917) $ (3,121) $ (3,340) $ (3,574) $ (3,824) $ (4,092) $ (4,378) Operating Stage Cash Flow 38 Year 0 Additional sales Resulting from Expansion 546,000 $ 589,680 $ 636,854 $ 687,803 $ 742,827 $ 802,253 $ 866,433 $ 935,748 41 Variable cost of additional product (327,600) $ (353,808) (382,113) $ (412,682) $ (445,696) $ (481,352) $ (519,860) $ (561,449) 42 Additional Fixed cost from expansion 100,000) $ (100,000) $ 100,000) $ (100,000) $ (100,000) $ (100,000) $ (100,000) $ (100,000 Depreciation on Building (18,375) $ (18,375) $ (18,375) $ (18,375) $ (18,375) $ (18,375) $ (18,375) $ (18,375) 44 Depreciation on Equipment (12,500) $ (12,500) $ (12,500) $ (12,500) $ (12,500) $ (12,500) $ (12,500) $ (12,500) Taxable Income 87,525 $ 104,997 $ 123,867 $ 144,246 $ 166,256 $ 190,026 $ 215,698 $ 243,424 46 Taxes (24,507) $ (29,399) $ (34,683) $ (40,389) $ (46,552) $ (53,207) $ (60,396) $ (68,159) 47 After Tax Income 63,018 $ 75,598 $ 89,184 $ 103,857 $ 19,704 $ 136,819 $ 55,303 $ 175,265 48 Depreciation Addback 30,875 S 30,875 S 30,875 $ 5 $ 30,875 $ 30,875 $ 30,875 49 Operating Stage Cash Flow 93,893 S 106,473 5 120,059 5 134,732 5 150,579 $ 167,694 5 186,178 5 206,140 50 51 2 Disposition Stage Cash Flow Year 56 Continuing Value $ 1,030,702.19 Total Cash Flows $ (889,600) $ 91,167 $ 103,556 $ 116,938 $ 131,392 $ 147,005 $ 163,870 $ 182,086 $ 1,232,465 59 60 NPV 448,425.25 61 Profitability Index 1.50 62 IRR 15.79% Payback Period (889,600) $ (798,433) $ (694,878) $ (577,940) $ (446,548) $ (299,542) $ (135,672) $ 46,414 $ 1,278,879 6.96 Present Value Payback Period ($889,600.00) $84,413.56 $88,782.27 $92,828.88 $96,577.25 $100,049.45 $103,265.92 $106,245.60 $665,862.33 ($889,600.00) ($805,186.44) ($716,404.18) ($623,575.30) ($526,998.04) ($426,948.59) ($323,682.67) ($217,437.08) $448,425.25 7.33 70 Change in NPV $ 0.26 Wk6 Building Modification Wk8 Bldg Modification (5% up) Wk8 Bldg Modification (5% down)A41 X V fx Variable cost of additional product A D E F G H K M N 0 P Q Year Acquisition Stage Assumptions Building Modification (700,000) Re-doing the kitchen, seating area, additional seating, more counter space Cost of Land Cost of Equipment 100,000 Kitchen equipment, new appliance, Promotional Advertising 50,000) Local Advertising (Only at 1 store) Employee Training (8 emp, $20/hr, 20 hrs training) (3,200) 8 employees, $20/hr, 20 hours training 10 Additional Investment in Working Capital 7% 7% 7% 7% 7% 7% 7% 7% 7% Working Capital Balance 36,400 $ 38,948 $ 41,674 $ 44,592 $ 47,713 $ 51,053 $ 54,627 $ 58 ,450 $ 62,542 12 Incremental Invest in working Capital 36,400) $ (2,726) $ (2,917) $ (3,121) $ (3,340) $ (3,574) $ (3,824) $ (4,092) $ 4,378) Operating Stage Assumption 5Additional sales Resulting from Expansion S 520,000 3% 8% 3% 8% 8% 3% 3% Additional Fixed cost from expansion 100,000 $ 100,000 $ 100,000 $ 100,000 100,000 100,000 $ 100,000 100,000 7 Variable cost of additional produc 60% 60% 60% 60% 60% 60% 60% 60% 18 Depreciation on Building 2.5% 2.5% 2.5% 2.5% 2.5% 2.5% 2.5% 2.5% Depreciation on Equipment 12.5% 12.5% 12.5% 12.5% 12.5% 12.5% 12.5% 12.5% Tax Rate 0.28 0.28 0.2 0.28 0.28 0.28 0.28 0.28 Acquisition Stage Cash Flow Year 6 Cost of Building Modification (40 yr depreciation) (700,000) Cost of Land (not depreciated) Cost of equipment (depreciated to 0 over 8 years) 100,00 Promotional Advertising (50,000) 1 Employee Training (3,200) Additional Investment in Working Capital (36,400) $ (2,726) S (2,917) $ (3,121) $ (3,340) $ (3,574) $ (3,824) $ (4,092) $ (4,378) 3 Total Acquisition Stage Cash Flow (889,600) $ 2,726) $ (2,917) $ (3,121) $ (3,340) $ (3,574) $ (3,824) $ (4,092) $ 4,378 Operating Stage Cash Flow Year Additional sales Resulting from Expansion 494,000 $ 533,520 $ 576,202 $ 622,298 $ 672,082 $ 725,848 $ 783,916 $ 846,629 41 Variable cost of additional product (296,400) $ (320,112) $ (345,721) $ (373,379) $ (403,249) $ (435,509) $ (470,350) $ (507,978) Additional Fixed cost from expansion 100,000) $ (100,000) $ (100,000) $ (100,000) $ (100,000) $ (100,000) $ (100,000) $ (100,000 Depreciation on Building (16,625) $ (16,625) $ (16,625) $ (16,625) $ (16,625) $ (16,625) $ (16,625) $ 16,625) 4 Depreciation on Equipment (12,500) $ (12,500) $ 12,500) $ (12,500) $ (12,500) $ (12,500) $ (12,500) $ (12,500 Taxable Income 68,475 $ 3 5 101,356 $ 119,794 $ 139,708 $ 61,214 $ 184,441 $ 209,52 Taxes (19,173) $ (23,599) $ (28,380) $ (33,542) $ (39,118) $ (45,140) $ (51,644) $ (58,667 7 After Tax Income 49,302 $ 60,684 $ 72,976 $ 86,252 $ 100,589 $ 116,074 $ 132, 798 $ 150,859 3 Depreciation Addback 29,125 $ 29,125 $ 29,125 $ 29,125 $ 29,125 $ 29,125 $ 29,125 $ 29,125 Operating Stage Cash Flow 78,427 5 89,809 5 102,101 5 115,377 5 129,714 $ 145,199 5 161,923 $ 179,984 2 Disposition Stage Cash Flow Year Continuing Value $ 899,921.03 Total Cash Flows $ (889,600) $ 75,701 $ 86,892 $ 98,980 $ 112,037 $ 126,141 $ 141,375 $ 157,831 $ 1,075,527 NPV 264,019.07 Profitability Index 1.30 2 IRR 12.80% Payback Period S (889,600) $ (813,899) $ (727,008) $ (628,028) $ (515,991) $ (389,851) $ (248,475) $ (90,644) $ 984,883 7.08 Present Value Payback Period ($889,600.00) $70,093.19 $74,495.50 $78,573.24 $82,350.42 $85,849.30 $89,090.47 $92,093.02 $581,073.93 ($889,600.00) ($819,506.81) ($745,011.31) ($666,438.07) ($584,087.65) ($498,238.36) ($409,147.88) ($317,054.86) $264,019.07 7.55 0 Change in NPV $ (0.26) Wk6 Building Modification Wk8 Bldg Modification (5% up) Wk8 Bldg Modification (5% down)A87 X v fx D G H Year 2 6 Acquisition Stage Assumptions Research and Development (20,000) Initial Promotion (8,333) New Supply Network (1,333) Employee Training (16,667) Vendor Testing (333) 10 Additional Investment in Working Capital 7% 7% 7% 7% 7% 7% 7% 7% 7% Working Capital Balance 1,492 $ 1,806 5 5,143 $ 5,502 5 5,888 $ 6,300 $ 6,741 $ 7,213 $ 7,718 Incremental Invest in working Capital (4,492) S (336) (360) $ (385) (412) $ (441) $ (472) $ (505) (540 ) Operating Stage Assumption Additional sales Resulting from Breakfast menu expansion ;4,167 5% 5% 5% 4% 4% 4% 3% 16 Lost Sale of Existing Products (10,000) $ (10,000) $ (10,000) $ (10,000) $ (10,000) $ (10,000) $ (10,000) $ (10,000) Variable Cost of new Product 60% 60% 50% 60% 50%% 60% 60% 60% Variable Cost of Old Menu Product 60% 60% 50% 60% 60% 60% 60% 60% Additional Fixed cost with New Product (500) (450) $ (400) $ (350) $ (300) $ (250) S (200) $ (150 Reduction Fixed cost with Old Product S 67 S 67 S 67 $ 67 $ 67 S 67 67 Tax Rat 0.28 0.28 0.28 0.28 0.28 0.28 0.28 0.28 Acquisition Stage Cash Flow 26 Year Research and Development (20,000) 29 Initial Promotion (8,333) 30 New Supply Network (1,333) 31 Employee Training (16,667) 32 Vendor Testing (333) Additional Investment in Working Capital (4,492) $ (336) $ (360) $ (385) $ (412) $ (441) $ (472) $ (505) $ (540) Total Acquisition Stage Cash Flow (51,158) $ (336) $ ( 360 ) $ ( 385) $ (412) $ (441) $ (472) $ (505) $ (540 ) Operating Stage Cash Flow 39 Year 41 Additional sales Resulting from Breakfast menu expansion 64,167 $ 67,375 $ 70,744 $ 74,281 $ 77,252 $ 80,342 $ 83,556 $ 86,063 42 Lost Sale of Existing Products 10,000) $ 10,000) $ 10,000) $ (10,000) $ (10,000) $ (10,000) $ (10,000) $ (10,000) Variable Cost of new Product (38,500) $ (40,425) $ (42,446) $ (44,569) $ (46,351) $ (48,205) $ (50,134) $ (51,638) Variable Cost of Old Menu Product 6,000 $ 6,000 $ 6,000 $ 6,000 6,000 $ 6,000 $ 6,000 $ 5.000 Additional Fixed cost with New Product (500) $ (450) $ (400) $ (350) $ (300) $ (250) $ (200) $ (150) Reduction Fixed cost with Old Product 67 $ 67 $ 67 67 $ 67 5 67 $ 67 S 67 Taxable Income 21,233 5 22,567 23,964 25,429 26,668 $ 27,954 $ 29,289 30,342 18 Taxes (5,945) $ (6,319) $ (6,710) $ (7,120) $ (7,467) $ (7,827) $ 18,201) $ (8,496) After Tax Income 15,288 5 16,248 17,254 19,201 5 20,127 $ 21,088 21 ,846 50 Disposition Stage Cash Flow Year Continuing Value $ 109,230 Total Cash Flows (51,158) $ 14,952 $ 15,888 $ 16,869 $ 17,897 $ 18,760 $ 19,655 $ 20,583 $ 130,536 NPV $ 110,540.93 61 Profitability Index 3.16 62 IF 36.68% 63 Payback Period S (51,158) $ (36,207) $ (20,319) $ (3,450) $ 14,447 $ 33,207 $ 52,861 $ 73,445 $ 203,981 64 3.19 Present Value each Year ($51,158.33) $13,844.05 $13,621.42 $13,391.18 $13,154.66 $12,767.50 $12,385.81 $12,010.12 $70,524.54 Accumulated Present Value ($51,158.33) ($37,314.28) ($23,692.86) ($10,301.69) $2,852.98 $15,620.47 $28,006.28 $40,016.40 $110,540.93 67 Present Value Payback Period 3.78 (2.16) Wk6 Breakfast Expansion Wk8 Brkfst Expansion (5% up) Wk8 Brkfst Expansion (5% down) +C D F G H Year 2 6 Acquisition Stage Assumptions Research and Development (20,000) Initial Promotion (8,333) New Supply Network (1,333) Employee Training (16,667) Vendor Testing (333) 10 Additional Investment in Working Capital 7% 7% 7% 7% 7% 7% 7% 7% 7% Working Capital Balance 4,492 $ 4,806 $ 5,143 $ 5,502 $ 5,888 $ 6,300 $ 6,741 $ 7,213 $ 7,718 12 Incremental Invest in working Capital (4,492) $ (336) $ (360) $ (385) $ (412) $ (441) $ (472) $ (505) $ (540) Operating Stage Assumption 15 Additional sales Resulting from Breakfast menu expansion 64,167 5% 5% 5% 4% 4% 4% 3% 16 Lost Sale of Exisiting Products (10,000) $ (10,000) $ (10,000) $ (10,000) $ (10,000) $ (10,000) $ (10,000) $ (10,000) Variable Cost of new Product 60% 60% 60% 60% 60% 60% 60% 50% Variable Cost of Old Menu Product 60% 60% 60% 60%% 60 60% 60% 60% 19 Additional Fixed cost with New Product (500) $ (450) $ (400) $ (350) $ (250) $ (200) $ (150) Reduction Fixed cost with Old Product 67 S 67 5 67 S 67 S 67 $ 67 $ 67 S 67 Tax Rate 0.28 0.28 0.28 0.28 0.28 0.28 0.28 0.28 Acquisition Stage Cash Flow 26 Year 2 8 Research and Development (20,000 29 Initial Promotion (8,333) 30 New Supply Network (1,333) Employee Training (16,667) 32 Vendor Testing (333) 3 Additional Investment in Working Capital (4,492) $ (336) $ (360) $ (385) $ (412) $ (441) $ (472) $ (505) $ (540) Total Acquisition Stage Cash Flow (51,158) $ (336) $ (360) $ (385) $ (412) $ (441) $ (472) $ (505) $ (540) Operating Stage Cash Flow Year 0 Additional sales Resulting from Breakfast menu expansion 67,375 $ 70,744 $ 74,281 $ 77,995 $ 81,115 $ 34,359 $ 87,734 $ 90 ,366 Lost Sale of Existing Products (10,000) $ (10,000) $ (10,000) $ (10,000) $ (10,000) $ (10,000) $ (10,000) $ (10,000 ) Variable Cost of new Product 40,425) $ (42,446) $ (44,569) $ (46,797) $ (48,669) $ (50,616) $ 52,640) $ (54,219) Variable Cost of Old Menu Product 6,300 $ 6,300 $ 6,300 $ 6,300 $ 6,300 6,300 $ 6,300 $ 6,300 Additional Fixed cost with New Product (500) $ (450) $ (400) $ (350) $ 300) $ (250) $ 200) $ (150) 46 Reduction Fixed cost with Old Product 67 $ 67 $ 67 67 $ 67 67 $ 67 $ 67 47 Taxable Income 22,817 $ 24,214 $ 25,679 5 27,215 5 28,513 29,860 $ 31,260 $ 32,363 48 Taxes (6,389) $ (6,780) $ (7,190) $ (7,620) $ (7,984) $ (8,361) $ (8,753) $ (9,062) After Tax Income 16,428 $ 17,434 18,489 19,595 5 20,529 21,500 22,507 23,301 50 Disposition Stage Cash Flow Year Continuing Value 116,507 58 Total Cash Flows $ (51,158) $ 16,092 $ 17,074 $ 18,104 $ 19,182 $ 20,088 $ 21,028 $ 22,002 $ 139,268 60 NPV $ 121,853.51 61 Profitability Index 3.3 62 IRR 39.08% 63 Payback Period (51,158) $ (35,067) $ (17,993) $ 111 $ 19,294 39,382 60,409 $ 82,412 $ 221,680 2.99 65 Present Value each Year ($51,158.33) $14,899.61 $14,638.40 $14,371.33 $14,099.65 $13,671.60 $13,250.98 $12,838.21 $75,242.07 Accumulated Present Value $51,158.33) ($36,258.73) ($21,620.33) ($7,249.00) $6,850.65 $20,522.25 $33,773.24 $46,611.45 $121,853.51 Present Value Payback Period 3.51 68 70 Change in NPV 0.10 71 72 73 Wk6 Breakfast Expansion Wk8 Brkfst Expansion (5% up) Wk8 Brkfst Expansion (5% down) +D G H Year Acquisition Stage Assumptions Research and Development (20,000) 6 Initial Promotion (8,333 New Supply Network (1,333) Employee Training (16,667) Vendor Testing (333) 10 Additional Investment in Working Capital 7% 7% 7% 7% 7% 7% 7% 7% 7% Working Capital Balance 4,492 $ 4,806 $ 5,143 $ 5,502 $ 5,888 $ 6,300 $ 6,741 $ 7,213 $ 7,718 Incremental Invest in working Capital (4,492) $ (336) (360) $ (385) $ (412) $ (441) $ (472) $ (505) $ (540) Operating Stage Assumption Additional sales Resulting from Breakfast menu expansion 64,167 5% 5% 5% 4% 4% 4% 3% 16 Lost Sale of Existing Products (10,000) $ (10,000) $ (10,000) $ (10,000) $ (10,000) $ (10,000) $ (10,000) $ (10,000) Variable Cost of new Product 60% 60% 60% 60% 60% 60% 60% 60% Variable Cost of Old Menu Product 60% 50% 60% 60% 60% 60% 60% 60% 19 Additional Fixed cost with New Product (500) $ (450) (400) $ (350) (300) $ (250) $ (200) $ (150 ) us u 20 Reduction Fixed cost with Old Product 67 S 67 S 67 S 67 S 67 S 67 S 67 S 67 Tax Rate 0.28 0.28 0.28 0.28 0.28 0.28 0.28 0.28 24 Acquisition Stage Cash Flow Year 0 7 8 28 Research and Development (20,000) 29 Initial Promotion (8,333) 30 New Supply Network (1,333) 31 Employee Training (16,667) Vendor Testing (333) Additional Investment in Working Capital (4,492) $ (336) $ (360) $ (385) $ (412) $ (441) $ (472) $ 505) $ (540) Total Acquisition Stage Cash Flow (51,158) $ (336) $ (360) $ (385) $ (412) $ (441) $ (472) $ (505) $ (540) Operating Stage Cash Flow 39 Year 0 Additional sales Resulting from Breakfast menu expansion 60,958 $ 64,006 $ 67,207 $ 70,567 $ 73,390 $ 76,325 $ 79,378 81,759 42 Lost Sale of Existing Products (10,000) (10,000) (10,000) $ (10,000) $ (10,000) $ (10,000) $ (10,000) $ (10,000) 43 Variable Cost of new Product (36,575) $ (38,404) $ (40,324) $ (42,340) $ (44,034) $ 45,795) $ (47,627) $ (49,056) Variable Cost of Old Menu Product 5,700 5 ,700 $ 5,700 $ 5,700 $ 5,700 5 ,700 5,700 5,700 45 Additional Fixed cost with New Product (500) (450) (400) $ (350) S (300) $ (250) $ (200) $ (150) 46 Reduction Fixed cost with Old Product 67 $ 67 $ 67 $ 67 $ 67 $ 67 $ 67 S 67 Taxable Income 19,650 $ 20,919 $ 22,249 $ 23,643 $ 24,822 $ 26,047 $ 27,318 $ 28,320 48 Taxes 5,502) $ (5,857) $ (6,230) $ (6,620) $ 6,950) $ (7,293) $ 7,649) $ (7,930) 49 After Tax Income 14,148 $ 15,062 5 16,019 5 17,023 $ 17,872 $ 18,754 5 19,669 5 20,391 50 2 Disposition Stage Cash Flow Year 56 Continuing Value 101,954 58 Total Cash Flows (51,158) $ 13,812 $ 14,702 $ 15,634 $ 16,611 $ 17,431 $ 18,282 $ 19,164 $ 121,804 60 NPV $ 99,228.36 61 Profitability Index 2.94 IRR 34.23% 63 Payback Period S (51,158) $ (37,347) $ (22,645) $ (7,011) $ 9,601 $ 27,032 $ 45,314 $ 64,478 $ 186,282 64 3.42 65 Present Value each Year ($51,158.33) $12,788.49 $12,604.44 $12,411.02 $12,209.68 $11,863.39 $11,520.63 $11,182.02 $65,807.01 66 Accumulated Present Value ($51,158.33) ($38,369.84) ($25,765.39) ($13,354.37) ($1,144.69) $10,718.69 $22,239.32 $33,421.35 $99,228.36 57 Present Value Payback Period 4.09 68 69 70 Change in NPV (0.10) Wk6 Breakfast Expansion Wk8 Brkfst Expansion (5% up) Wk8 Brkfst Expansion (5% down)
Step by Step Solution
There are 3 Steps involved in it
1 Expert Approved Answer
Step: 1 Unlock
Question Has Been Solved by an Expert!
Get step-by-step solutions from verified subject matter experts
Step: 2 Unlock
Step: 3 Unlock
Students Have Also Explored These Related Finance Questions!